KEYWORDS
Aging patient population, crowding, emergency department, prediction model, triage
INTRODUCTION
Elderly patients represent a growing population in the Emergency Department (ED).1-3 Older patients, defined as aged 70 years and over, are overall more vulnerable than the general adult population. They have less physical endurance, are more likely to have multiple co-morbidities,4 and are also more susceptible to polypharmacy and associated risks.5 In the ED, elderly patients have a longer length of stay (LOS) compared to younger patients.6-9 This can be partly explained by an atypical and non-specific presentation of illnesses in the ED.10-12 Moreover, symptom-based triage classifications tend to underestimate the severity of disease,13-15 whilst elderly patients visits in general have a greater level of urgency.6,16 As a consequence, care for elderly is more complex and elderly patients are more often assessed by multiple specialists.17 LOS in the ED is associated with poorer quality of care and may have negative effects on outcomes for the individual patient. Time spent in the ED correlates strongly to the total LOS in the hospital,18 and periods of longer LOS due to ED crowding are associated with increased inpatient mortality.19 Predicting which patients should be admitted directly after presentation to the ED may reduce waiting times and time to treatment whilst improving diagnostic trajectories and quality of patient care. It has been suggested that new strategies to decrease ED LOS can decrease patient morbidity and healthcare expenditure.20,21 Certain patient characteristics, such as aberrant vital parameters, have been shown to be predictive for admission,22,23 yet it is unknown which set of predictors contributes most to admission. We aimed to develop and validate a prediction model for admission, using non-invasive and readily available variables, applicable to the general elderly population at the ED.
MATERIALS AND METHODS
Study design
We performed a retrospective cohort study. Data from one hospital was used for model development and data from two other hospitals were used for external validation.
Setting and participants
For model development, data were acquired from a large consecutive ED cohort in the Erasmus University Medical Centre, Rotterdam (Erasmus MC), the Netherlands, including all patient visits in the ED from January 1st, 2012 until June 30th, 2014. This ED is a level 3 trauma centre and is situated in the largest hospital in the Netherlands, with 30,000 patient visits annually. Elderly patients, defined as people aged 70 years and over, were selected from this database. Both the first visit of a patient as well as repeat visits were included. Patients were excluded when they died on presentation or died during the ED visit. For external validation, data from the Leiden University Medical Centre (LUMC), which is the academic hospital situated in Leiden, the Netherlands, with approximately 27,000 ED visits annually, and the Medisch Spectrum Twente (MST), a large teaching hospital in Enschede, the Netherlands, with approximately 26,500 ED visits annually, were used. In the LUMC, data were used from an existing database with patients visits in the ED in 2012. For external validation in MST, data were collected from all patients visiting the ED within the first three days of each month in 2015.
Variables and measurement
Outcome was defined as admission or transfer to another hospital for admission, and was collected from the patient records. Basic characteristics including information on sex and age were retrieved from the patient records. Additional ED arrival information was extracted from the patient charts, containing time of arrival and discharge from the ED, triage classification based on the Manchester Triage System,24 vital parameters at arrival (blood pressure (in mmHg), heart rate (per minute), respiratory rate (RR) (per minute), body temperature (in degrees centigrade), peripheral oxygen saturation (SpO2, in percentage), state of consciousness using the AVPU25 or Glasgow Coma Scale scoring system26 (AVPU/GCS), laboratory testing (yes/no), radiology testing (yes/no), and referral status to the ED (i.e., by ambulance, self-referral, by general practitioner).
After merging all the different variables from the patient record, the patients were coded in order to anonymise the collected data. Only contributors to the study had access to the database. This study was evaluated and approved by the Medical Research Ethics Committee of the Erasmus MC. Potential predictors were categorised based on to their normal values. Body temperature was categorized in four groups (≤ 35.9, 36.0-37.0, 37.1-38.4, ≥ 38.5 ̊C). Heart rate was classified in three categories based on the categories used in the Modified Early Warning Score (MEWS). The MEWS is a guide to aid in recognition of deteriorating patients and is based on physiological parameters.27 In order to facilitate a clear model, the original five MEWS categories were reduced to three (≤ 50, 51-100, > 100 bpm). Both systolic and diastolic blood pressure were coded according to the current definition of hypotension (< 90 vs. < 60 mmHg) and hypertension (> 140 vs. > 90 mmHg) for systolic and diastolic blood pressure, respectively. RR was categorised according to the definition of bradypnoea (< 12 times per minute), normopnoea (12-20 times per minute), and tachypnoea (> 20 times per minute). SpO2 was classified in three groups (≤ 92, 93-97, ≥ 98%). Finally, referral status in the ED was coded in three classes based on whether patients were (1) referred by any specialist or general practitioner; (2) arrived by ambulance, in which case the ambulance nurse decided to present the patient at the ED; or (3) were self-referred. In every parameter a missing value category was created to make the model better applicable in daily practice.
Statistical methods
Univariate logistic regression was used to assess the association between potential predictors and admission. The predictive value was assessed and quantified with the Akaike Information Criterion (AIC) based on the Likelihood Ratio χ2 (LRχ2 ). The AIC is a measure of the relative quality of a model or a parameter and can be used when the database is large and selection on p value will result in a large number of selected parameters. The selected predictors from the univariate analysis were combined in a multivariate model and selection of the final set of predictors was based on added values of each predictor (based on the AIC) and clinical knowledge.
Statistical methods Univariate logistic regression was used to assess the association between potential predictors and admission. The predictive value was assessed and quantified with the Akaike Information Criterion (AIC) based on the Likelihood Ratio χ2 (LRχ2 ). The AIC is a measure of the relative quality of a model or a parameter and can be used when the database is large and selection on p value will result in a large number of selected parameters. The selected predictors from the univariate analysis were combined in a multivariate model and selection of the final set of predictors was based on added values of each predictor (based on the AIC) and clinical knowledge.
The performance of the model was calculated using the Area Under the Receiver Operating Characteristic (AUC). During internal validation, the AUC was corrected for overfitting using the bootstrapping method28 on the dataset, with repetition of the procedure of 500 times. External validation was performed in the LUMC and MST databases. For validation, 100 events of ‘admission’ and at least 100 non-events were required to occur.29 Based on admission rates in both LUMC and MST, we considered a validation sample of at least 500 patient visits to be sufficient for external validation of our model.
The external validity was examined by calibration and discrimination of the model in the validation samples, using calibration plots and the AUC. In the calibration plot, the calculated probability of admission is plotted against the observed admission. The calibration slope is the regression coefficient of the model in which the linear predictor (admission yes or no) is the only parameter. Ideally, the slope is 1.30,31 The intercept in the plot indicates whether predictions are systematically too high or too low and should ideally be zero.32 In the LUMC database, data on whether radiology tests had been performed were not recorded. Therefore, we developed a new model on the data following the same strategy for model development, however, leaving out radiology testing. This alternative model was validated in the LUMC sample.
Subsequently, a score chart was developed based on the regression coefficients fitted on the combined data. Therefore, data on radiology testing were imputed for the LUMC database using multiple imputation. An application was built to calculate the chance on admission to facilitate accessibility of the tool in day-to-day practice.33 To aid in the decision whether preparations for admission should be started for a specific patient, a specific cut-off point of chance on admission should be determined to guide this decision. Such a cut-off should be based on sensitivity and specificity and the importance of avoiding false-negatives and false-positives (i.e., taking action in a patient that in the end does not need to be admitted versus taking no action in a patient that does need to be admitted). Sensitivity, specificity, positive predictive value (PPV), and negative predictive value (NPV) for a range of possible cut-offs in the combined cohort of the MST and LUMC cohorts were calculated.
All analyses were undertaken using R statistics version 3.1.3 (March 9th, 2015).34 The foreign library was used to transfer the database from SPSS (version 21) to R.35 For model development, the lrm function of the rms package was used.36 Finally, the calibration plot was built using the val.prob.ci function, which is an adjustment to the val. prob function of the rms package. For the application, we used Rstudio.35
RESULTS
Participants
The derivation database consisted of 76,663 ED visits between January 2012 and June 2014. Selection on age of 70 and over reduced the number to 5,265 patients who visited the ED 7,606 times. The admission rate was 54%. In the derivation group, 55.8% of the patients were male and the median age was 76 years. The validation dataset consisted of 4,250 patient visits from LUMC, of whom 45% were admitted and 563 patient visits from MST, of whom 71% were admitted (table 1)
Predictors of admission
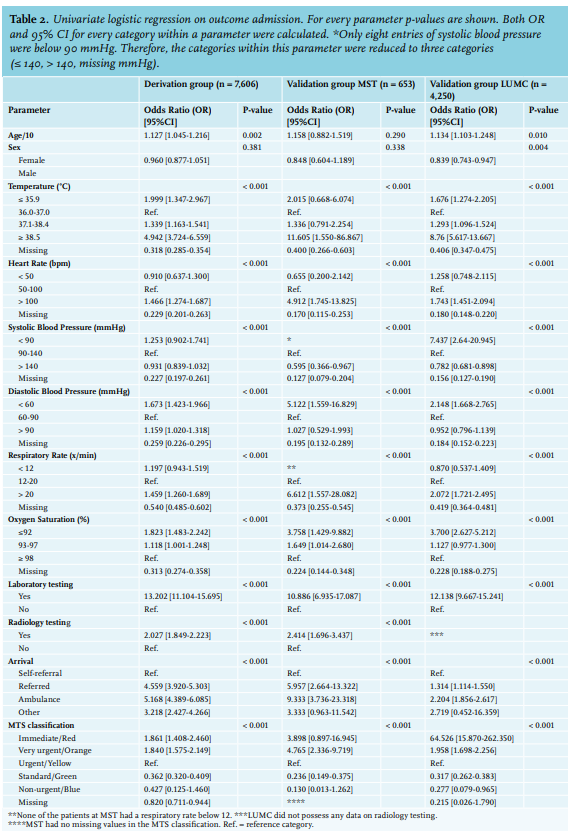
In the derivation cohort, the strongest predictors of admission were laboratory testing (OR [95% CI]: 13.202 [11.104-15.695], p: < 0.001) and arrival by ambulance (OR [95% CI]: 5.168 [4.389-6.085], p: < 0.001) (table 2). The categories ‘referred’ and ‘arrival by ambulance’ in the predictor referral status had similar odds ratios and were therefore combined. The ‘immediate’ (red) and ‘very urgent’ (orange) triage groups in the MTS classification were also combined. These adjustments did not alter the model performance.
Model development
Based on the AIC, we included the following parameters in the final model: laboratory testing, body temperature, heart rate, diastolic blood pressure, systolic blood pressure, SpO2, respiratory rate, referral status, MTS category, and radiology testing, which yielded an AUC of 0.770. Bootstrap resampling decreased the performance by 0.004, resulting in an internally validated AUC of 0.766.
External validation
Patient characteristics in the derivation and validation cohort did not significantly differ, except for admission rates in MST. The univariate effects of the predictors within the validation and derivation cohort were comparable.
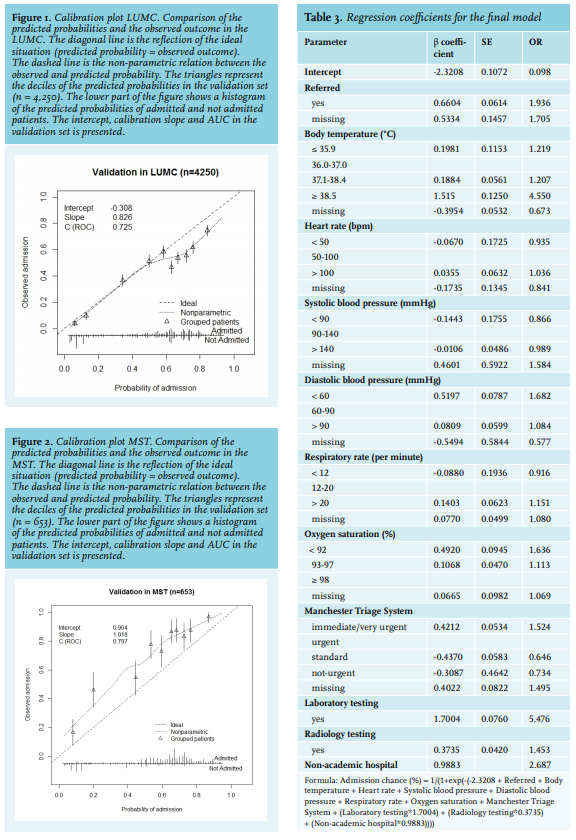
However, the OR for MTS classification ‘immediate’ in the LUMC was higher than in Erasmus MC and MST (OR [95% CI]: 64.526 [15.870-262.350] versus 1.861 [1.408-2.460] versus 3.898 [0.897-16.945], respectively). Discrimination in the LUMC data showed an AUC of 0.725. The calibration plot showed an intercept of -0.308, reflecting the fact that the overall admission rate was lower (45%) compared to the development cohort. The calibration slope was 0.826 (figure 1). Discrimination in the MST data showed an AUC of 0.797. However, MST had an admission rate of 71 per 100 patient visits, resulting in a calibration intercept of 1.018 and a calibration slope of 0.904 (figure 2). 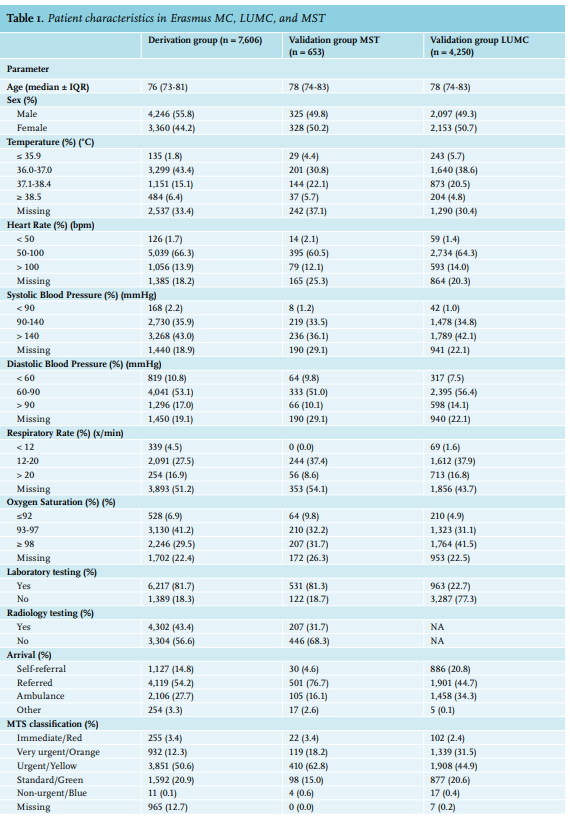
Score chart
The final model was named ‘CalcuLation of the Elderly Admission Risk in the Emergency Department’ (CLEARED) tool and can be used to calculate the probability of admission. We used the parameters from the derivation cohort and introduced a ‘hospital factor’ to correct for the differences between admission rates of MST (non-academic hospital) and Erasmus MC/LUMC (academic hospital). The formula is presented in table 3; the online application is accessible through the following link: http://bit.ly/clearedtool.
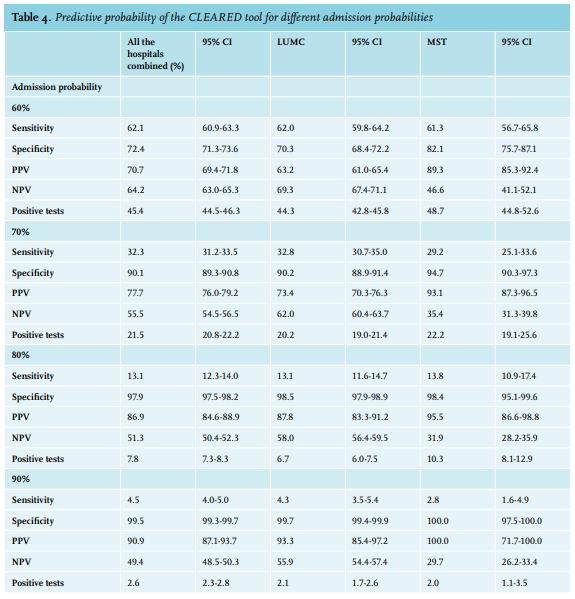
We calculated predictive probabilities of the CLEARED tool of admission for decile cut-off points (table 4). The predictive probabilities for the separate MST and LUMC cohorts were similar, however PPV was higher for MST. This could be explained by the higher admission rate. The positive predictive value ranged from 0.57 to 0.91. This indicates that in the highest decile, 91% of the patients were correctly admitted. An admission cut-off point of 80% would result in the identification of 7.8% (n = 975) who are eligible for earlier admission. Of these patients, 86.9% (n = 847) were actually admitted, meaning that there were 13% unnecessary hospital admissions. Patients with a low admission risk (< 80%) had a similar ED LOS than patients who were admitted with a high admission risk (> 80%). However, patients who were eventually discharged despite a positive advice indicated by the CLEARED tool, had a significantly longer LOS, median 223 vs. 185 vs. 178 minutes (p < 0.001), respectively.
DISCUSSION
The aim of this study was to develop and validate a prediction model for admission for the general elderly population presenting to the ED. We successfully developed the CLEARED tool using data from our retrospective cohort study; a prompt that accurately predicts admission of elderly patients visiting the ED. External validation showed accurate performance. As outlined in the introduction, increased LOS in the ED has detrimental effects on elderly patients. This is not only because the time to adequate treatment is lengthened, but also due to the stay in the ED itself, which enhances the development of a delirious state.37,38 In our hospital after arrival at the ED, initial evaluation and triage of urgency is performed by a nurse followed by a primary survey of the patient by a physician, followed by diagnostics tests. The decision whether or not to admit the patient to the hospital is made only after the results of the diagnostics are known. Subsequently, a hospital bed request is made and the patient awaits transfer to the ward. In this way, decision-making about admission is late in the process, which causes a marked increase of LOS in the ED.39 The use of the CLEARED tool can detect elderly patients who are to be admitted to the hospital, shortly after their arrival in the ED. From that moment on, admission to the hospital can be organised without delaying the diagnostic and therapeutic processes. This can dramatically shorten the LOS in the ED for patients. Further reduction of LOS may be possible when using the CLEARED tool in combination with an acute medical unit.
An increasing number of Dutch hospitals have an acute medical unit. In these hospitals, patients who are identified as in need of admission, can be transferred to such a unit where, after the initial diagnostics and therapeutic interventions are performed in the ED, further diagnostics and treatment can be completed. The incorporation of an acute medical unit in addition to the CLEARED tool can further reduce LOS in the ED, which enhances the workflow in the ED and reduces crowding. An acute medical unit is not necessarily a unit, from which every patient gets admitted in-hospital. It can also function as an extension of the ED, allowing observation of patients for several hours, followed by admission or discharge. In our opinion, patients with a high chance of admission according to the CLEARED tool should be admitted to the acute medical unit as early as possible to optimise patient flow through the ED. If admission is not needed – even with a positive CLEARED – they can easily be discharged, which is in line with current practice.
One of the key points of the CLEARED tool is the inclusion of vital parameters as predictors for admission. Using these parameters, we are able to form a better estimate of the severity of illness of a patient, which is the main reason for admission. These parameters are also readily available on arrival at the ED, and are measurements that are routinely performed when patients enter the ED. This makes the CLEARED tool easily applicable.
Another strength of our model is that it is developed using a large database, which reduces the chance of overfitting and limits the uncertainty of the model. Several other prediction models to predict admission have been previously developed. The identification of Seniors at Risk tool (ISAR) is the most well-known screening tool to identify elderly with a high chance of adverse outcomes.40 This screening tool is composed of six ‘yes-no’ questions on major topics like cognitive impairment, polypharmacy, and previous hospital admission. The main aim of the ISAR tool is to identify patients at risk of loss-offunctionality after a hospital stay, and not to identify patients at risk of clinical deterioration and death. The predictors used in the ISAR tool differ vastly from the predictors in our study. In contrast to the CLEARED tool, the ISAR tool focuses on the pre-existing situation before arriving at the ED, in contrast CLEARED, which focuses on vital parameters at presentation. Therefore, gathering information for the ISAR tool takes more time. The discrimination performance of the ISAR for admission ranges from 0.65 [0.62-0.68]41 to 0.68 [0.66-0.70],42 which is lower than our model.
Similar to the ISAR, is the Triage Risk Screening Tool (TRST), which also comprises of six ‘yes-no’ questions, such as cognitive and physical impairment, polypharmacy, previous ED visits, and hospitalisation.43 This model is tested for admission in two studies and performed with an AUC of 0.64 and 0.66, respectively.42,43 Other admission prediction tools for elderly are triage based (AUC = 0.73, 0.77, 0.741),44-46 the Silver Code (AUC = 0.63),41 and a tool derived by Yip et al. (AUC = 0.713).47 Unfortunately, many of these models have not been externally validated.
The higher AUC of our tool suggests that the CLEARED tool is superior in discrimination, although the AUC is, apart from a measure of model performance, also a reflection of the underlying population. Therefore, a prospective validation study should be performed comparing all the existing tools in one large database. A merit of the external validation of the CLEARED tool was that it was performed in both an academic and a large non-academic teaching hospital. The discrimination remained high in both centres, and calibration was good in the LUMC, but our model underestimated the chance of admission in MST. This was most likely due to the high admission rate (71%) in this centre and possibly a difference in population as it is located in different part of the country. A factor was introduced to account for the fact it is a non-academic teaching hospital, although we were unfortunately unable to confirm this with other non-academic hospitals. We expected that patient characteristics might differ between academic and non-academic hospitals; nonetheless, it is satisfactory that the CLEARED tool performs well in both settings. This makes it more likely that the model can be generalised to other EDs.
When the CLEARED tool is eventually implemented in clinical practice, we recommend that implementation takes place in a stepwise process. First, validation of the model should take place to establish its congruency with local protocol. Next, all caregivers in the ED, especially triage nurses, should be familiar with the model. To make the model better applicable in clinical practice, we developed an online application, which will automatically calculate the chance of admission after measurement of the parameters. To further determine practical applicability and predictive power, a prospective study should be performed.
Our study has several limitations. A general limitation of this study is that the prediction model is developed based on a retrospective database. As a result, not all parameters that are considered in the model are completely accurate, which could have resulted in biased estimates of the effect of certain predictors. For example, it was not assessed whether oxygen therapy was administered before collecting data on both SpO2 and respiratory rate. Therefore, the predictive value of these variables is probably underestimated in the CLEARED tool. The need for oxygen therapy on its own could also be an independent predictive variable, however, a prospective study is needed to confirm this. In addition, respiratory rate was only recorded in just more than half of patient entries. An explanation for this could be that the respiratory rate was only measured when the patient was already in a more severe condition. The predictive value of respiratory rate as an independent variable should be evaluated more in future study.
Inevitably, there were many missing values. In order to deal with missing values and prevent losing data, missing values were categorised in a separate group. Using this method, the model can always be applied, even when not all parameters are recorded. In conclusion, the CLEARED tool can accurately predict admission in the elderly. It proved to exceed the performance of comparable tools. However, further research is needed to implement the tool and to evaluate the effect of the CLEARED tool on LOS and crowding in the ED, length of hospitalisation, and mortality.
ACKNOWLEDGEMENTS AND DISCLOSURES
The authors would like to thank Marcel Eitink for making the data available at MST. All authors confirm they have no conflicts of interest. No funding or financial support was received.
PRESENTATIONS
Dutch Acute Medicine Conference, June 10th, 2016, Enschede (winner, presentation award).
REFERENCES