KEYWORDS
Acute respiratory infections in secondary care, crude mortality, primary care consultations, severe acute respiratory infections
INTRODUCTION
Most European countries, including the Netherlands, have a well-established near real-time (weekly) surveillance system for influenza-like illness (ILI) or other acute respiratory infections (ARI) in primary care. In contrast, real-time surveillance data about severe acute respiratory infections (SARI), i.e., patients requiring hospital admission, is rarely available. The limited historic and real-time data on severe respiratory infections requiring hospitalisation became recently apparent during the severe 2017/2018 influenza epidemic in the Netherlands.1 During the 2017/2018 winter season, broad media attention was generated on hospitals that were overwhelmed by patients with influenza virus infections.2 These media reports reflected the severity of the influenza epidemic that resulted in shortages in bed capacity and medical staffing. This could not be confirmed by surveillance data because a national representative SARI surveillance system is currently unavailable.1 In addition, the ongoing COVID-19 pandemic also shows the importance of real-time syndromic surveillance data for early detection of signals that require further investigation. Surveillance is a vital tool to monitor shifts in the occurrence and burden of infections and diseases in the population.3,4 Assessing the severity of an influenza epidemic in time, place, and person is essential to guide control activities, to assess the impact on healthcare systems, and to guide communication with the public and the media. In the Netherlands in primary care, weekly surveillance of ILI by sentinel general practitioners (GPs) was established in 1970 and virological test results were added in 1992, providing robust longitudinal data on incidence of ILI and influenza virus infection in the general practice population. The Dutch mortality monitoring system provides data on the total number of deaths from all causes, stratified by age group and region, with a weekly analysis of excess mortality.5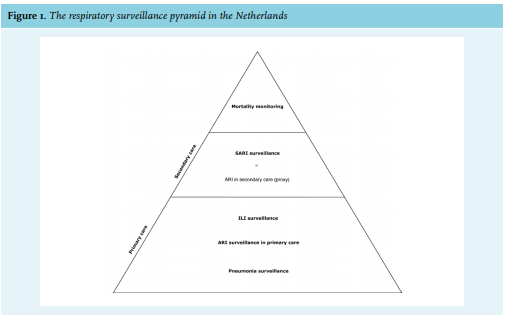 It is a near real-time surveillance system, but the weekly mortality data are not disease-specific. The Dutch respiratory surveillance pyramid summarises these surveillance systems at different levels of care (figure 1). In the Dutch healthcare system, the GPs have a gatekeeping role for referral to specialised care.
SARI surveillance has been the missing link in the existing respiratory infections surveillance systems in the Netherlands. The Dutch Hospital Data (DHD) is a national register of hospital discharge diagnoses using International Statistical Classification of Diseases and Related Health Problems (ICD) codes.6 However, it is available with a one-year time-lag and therefore not suitable for real-time surveillance. In 2015, a pilot study by the National Institute for Public Health and the Environment (RIVM) started in two hospitals, Leiden University Medical Center (LUMC) and Jeroen Bosch Hospital (JBH), with the main objective to set up SARI surveillance.7,8 As part of this pilot study, historical SARI data from LUMC were made available for analysis in the current study, aiming to assess the value of routinely collected data on respiratory infections in hospitals and the added value of SARI surveillance. Positioning SARI surveillance in relation to other existing respiratory surveillance data is important to interpret the potential added value of SARI surveillance.
MATERIALS AND METHODS
ARI in secondary care database
Data on patients with an ARI receiving specialist care during the period between week 40 of 2008 and week 20 of 2016 were provided by the LUMC, a 585-bed tertiary university teaching hospital in Leiden, province of South Holland, the Netherlands. Patients with ARI were defined as those consulting the LUMC Emergency Department (ED) or outpatient clinic who were registered with diagnostic codes corresponding to a respiratory tract infection (RTI). These codes were based on the Dutch financial coding system, applied by the national Dutch Healthcare Authority (NZa), and used by all healthcare facilities in the Netherlands.8 Depending on ARI severity, these patients were admitted to an intensive care unit (ICU) or regular ward or discharged for treatment at home. Patients discharged without admission do not completely fulfil the World Health Organization (WHO) SARI case definition,9 and we were unable to distinguish outpatients from admitted patients. Therefore, we used ‘ARI in secondary care’ as a proxy for SARI. The database included consultation date, gender, and ward of admission (ICU/non-ICU),8 but not microbiological data. The Dutch Medical Research Involving Human Subjects Act did not apply to this study, because only fully anonymous data were used and there were no interventions other than routine clinical care. A waiver for full medical ethical review was obtained from the Medical Ethical Committee of the University Medical Center Utrecht (reference number WAG/om/15/034147).
Primary care databases
Influenza-like illness
Data from the Sentinel Practices of NIVEL Primary Care Database were used to calculate the incidence of ILI in primary care from week 40 of 2008 to week 20 of 2016.10 The participating GP practices (39 practices with 60 GPs) report on the weekly number of patients consulting them for ILI, which is defined as 1) sudden onset of symptoms, 2) fever, and 3) at least one of the following symptoms: cough, rhinorrhoea, sore throat, frontal headache, retrosternal pain, or myalgia.11 The population covered by this sentinel network is approximately 0.7% (124,000 patients) of the Dutch population (17.2 million) and is representative for age, gender, regional distribution (Supplementary file*, figure 1), and population density.11 In the Netherlands, an influenza epidemic is declared if the incidence of ILI in primary care is above the threshold of 5.1 per 10,000 persons per week for at least two consecutive weeks in combination with the detection of influenza virus in combined nasal and throat swabs from a selection of these ILI patients.1
Acute respiratory infections in primary care
Data on patients consulting a GP for acute respiratory infection (e.g., sinusitis, laryngitis, bronchitis, or influenza) were obtained from the Nivel Primary Care Database from week 40 of 2009 until week 20 of 2016. ARI in primary care is less specific for influenza virus infection than ILI, but seasonal estimates are highly correlated.
Pneumonia in primary care
Data on patients consulting a GP for pneumonia were also obtained from the Nivel Primary Care Database from week 40 of 2009 to week 20 of 2016. Pneumonia in primary care is diagnosed by the GP mostly on clinical judgement. The sentinel network for ARI and pneumonia in primary care consists of 419 GPs, covering approximately 10% (1.7 million) of the Dutch population.12
Crude mortality monitoring
Deaths are recorded by municipalities and then reported to Statistics Netherlands.13 During the 2009 influenza pandemic, RIVM and Statistics Netherlands initiated a weekly monitoring system for crude mortality. It monitors the total reported number of deaths from all causes, stratified by age group and region. The presence of excess mortality is verified and reported weekly.5 For our observational study, all-cause mortality data were collected from Statistics Netherlands for the province of South Holland, the Netherlands, with over 3.6 million persons in the period from week 1 of 2009 though week 20 in 2016.14 Provincial data were used because it was not feasible to obtain crude mortality data for the LUMC catchment population.
Statistical analysis
Definitions and calculations 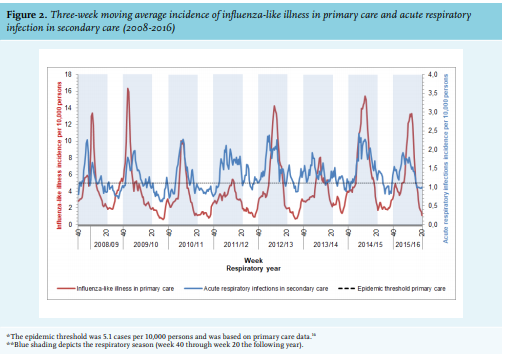
Data are presented for both the ‘respiratory year’ and ‘respiratory season’, defined respectively as the period from week 40 through week 39 of the following year, and the period from week 40 through week 20 the following year. Data for 2015/2016 are limited to the respiratory season (week 40 of 2015 through week 20 of 2016). The incidence for ARI in secondary care was calculated as the number of patients consulting the hospital per week, divided by the total number of persons in the LUMC catchment population (182,704), and expressed per 10,000 persons (Supplementary file*, figure 2). A hospital catchment population is defined as the median number of persons who would attend the hospital where they would require treatment.15 The catchment population was calculated by dividing the total number of hospitalisations due to RTI in the LUMC by the total number of hospitalisations due to RTI in the Netherlands and multiplying this proportion by the total Dutch population size. The data required for the calculation of the catchment population was provided by Dutch Hospital Data.6 A selection of WHO ICD-10 codes related to RTI (J00-J22, A15, A16, A48.1, A70, and A78) was determined for the LUMC for the years 2014 through 2016. These years were selected because they reflected the most up-to-date situation at the time of the study. Taking into account the non-normal distribution of the catchment population over the years 2014 through 2016, we used the median value for our incidence calculations.
The ILI incidence in primary care was calculated as the number of ILI patients consulting the GP per week, divided by the total number of patients registered in the participating practices, and expressed per 10,000 persons. The ARI incidence in primary care and pneumonia in primary care are calculated in the same way from the larger Nivel Primary Care Database. The crude mortality in the province of South Holland, the Netherlands, was calculated as the number of deceased patients, divided by the total population of the province of South-Holland and expressed per 10,000 persons. It is important to note that crude mortality was used only for comparing trends, as it reflected a larger population than the LUMC catchment population. Therefore, the magnitude of all-cause mortality per week was not relevant to this study.
Measures of disease frequency
Descriptive statistics were used to compare trends in ARI in secondary care, ILI, ARI and pneumonia in primary care, and crude mortality, including three-week moving average incidences and peak incidence. The peak incidence per season for ARI in secondary care, ILI, ARI, and pneumonia in primary care, and crude mortality was defined as the highest incidence in a season. Three-week moving averages are used to smooth out the trend by filtering out ‘noise’ from weekly incidence fluctuations. The time-lag between respiratory surveillance systems was defined as the number of weeks between incidence peaks, relative to ARI in secondary care. Median and interquartile range (IQR) were used to describe these time-lags. Statistical differences between time-lags were calculated using the Kruskal Wallis test. Statistical analysis was performed using SPSS (version 22) and Excel (version 2010).
RESULTS
ILI in primary care versus hospital consultations
Three-week moving incidence averages of ARI in secondary care and ILI in primary care showed clear peaks during the respiratory season. On visual inspection of the time series, elevations of ARI in secondary care appear broader than for ILI (figure 2).
High ILI incidence was confined to the respiratory season (e.g., week 40 through week 20 the following year), whereas ARI incidence in secondary care showed a more diverse pattern, with clear peaks more frequent in winter, but not entirely restricted to the respiratory season.
The highest peak in weekly incidence for ARI in secondary care was 3.9 cases/10,000 persons (week 1 of 2015), and peak ILI incidence was 19.1 cases/10,000 persons (week 46 of 2009) (Supplemental file*, table 1). The ARI peaks in secondary care generally occurred earlier than the ILI peaks in primary care, except during the influenza pandemic season of 2009/2010 and the post-pandemic season of 2010/2011. Overall, the median time-lag between ARI in secondary care and ILI peaks was 6.5 weeks (IQR 0-9 weeks). No statistical difference was found with regard to time-lags between respiratory seasons (Kruskal Wallis test; p = 0.4). During the six seasons in which ARI peaked before ILI, the median time-lag was eight weeks (IQR 6-9 weeks) (Kruskal Wallis test; p = 0.4).
ARI in primary care versus hospital consultations
ARI in primary care showed similar broader peaks, when compared to ARI in secondary care (figure 3). The ARI peaks in secondary care preceded ARI in primary care during six respiratory seasons, except during 2009/2010 and 2010/11 (table 1). The median time-lag between ARI in secondary and primary care was seven weeks (IQR -4-9), but differences between respiratory seasons were not significant (Kruskal Wallis test; p = 0.4).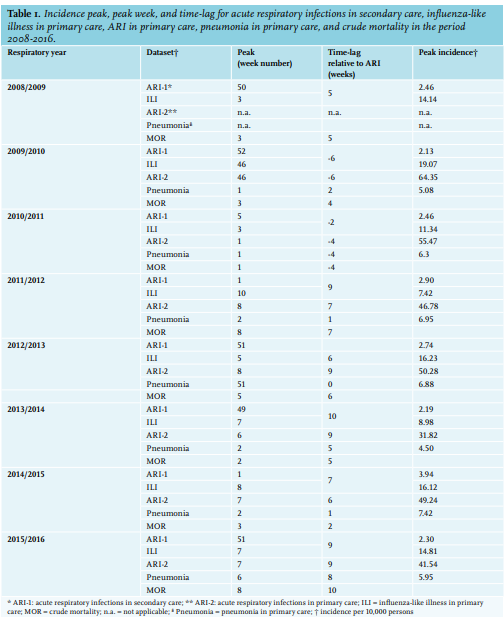
Pneumonia in primary care versus hospital consultations
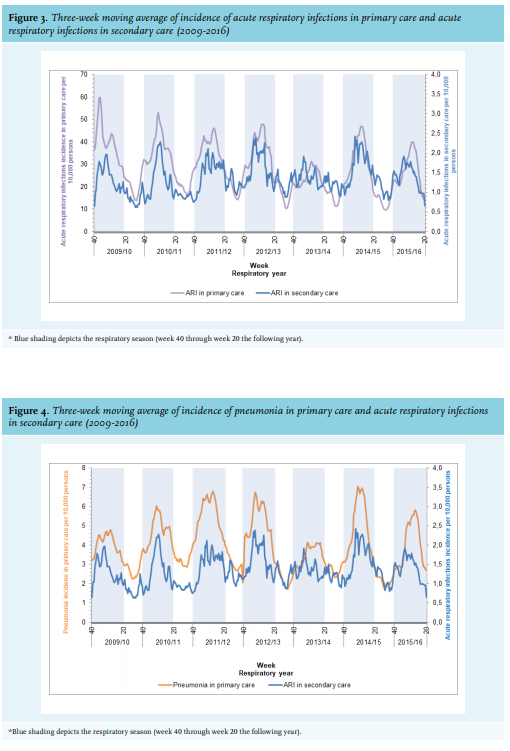
On visual inspection, time trends of pneumonia in primary care appear to have a similar pattern as ARI in secondary care (figure 4). The ARI peaks in secondary care preceded pneumonia peaks in primary care with a median time-lag of one week (IQR 0-5) (Kruskal Wallis test; p = 0.4). In respiratory season 2012/2013, the peaks of ARI in secondary care and pneumonia in primary care occurred in the same week (week 51 of 2012).
Crude mortality versus hospital consultations
Mortality in the province of South Holland, the Netherlands, as well as ARI in secondary care show winter peaks in the respiratory season. However, crude mortality elevations appear broader with less well-defined peaks than ARI elevations (figure 5.). Overall, the crude mortality peak lagged a median five weeks behind the ARI peak (IQR 3-7 weeks) (Kruskal Wallis test; p = 0.4). 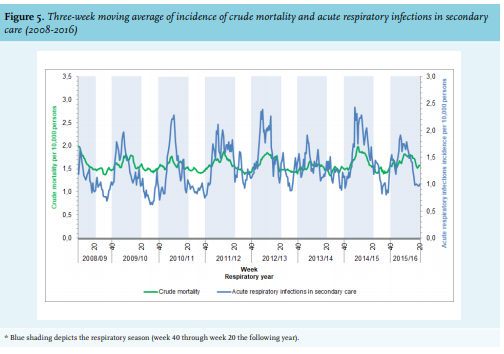
DISCUSSION
This observational study demonstrates that routinely collected data can be used for describing trends of ARI in secondary care and may be suitable for near real-time SARI surveillance. We show that ARI incidence in secondary care peaked earlier than ILI, ARI incidence in primary care, and crude mortality with a considerable time-lag. Pneumonia in primary care had a shorter time-lag, only one week behind ARI in secondary care.
Routinely collected data on respiratory infections
Our principal finding that ARI in secondary care peaks before ILI, ARI, or pneumonia in primary care in most respiratory seasons could be explained by high-risk patient groups. We hypothesise that hospitalisations for ARI early in the respiratory season largely consists of high-risk elderly patients with comorbidities or young children. Young children could also be responsible for the earlier peak because of hospital admissions for respiratory syncytial virus infection.17 In addition, as in many European countries, the Dutch population is ageing, and elderly patients with comorbidities increasingly live at home.18,19 This frail, high-risk patient group is associated with an increased demand for hospital admissions.20-22 In other words, this high-risk group is likely to be referred to, and subsequently admitted to, the hospital earlier because of respiratory infections than relatively healthy persons. In most seasons, this demand could be reflected in an earlier incidence peak for ARI in secondary care compared to the incidence peak for ILI, ARI, and pneumonia in primary care. Only for the pandemic and post-pandemic seasons did we find an inverted time-lag for ILI and ARI in primary care, which is difficult to explain without additional data on co-morbidities and microbiological test results. However, a disproportionately higher ARI incidence in the younger age groups versus older age groups is likely to play a role.23,24
Pneumonia in primary care might be the best proxy for ARI in secondary care, because it has shortest median lag-time with ARI in secondary care compared to the other surveillance systems. An explanation of this finding could be that patients diagnosed and treated for CAP in primary care by their GP are most likely to be referred to a hospital if the antibiotics do not have the expected effect.
ARI incidence in secondary care and crude mortality showed similar trends, with peaks in winter over a period of eight respiratory years. The seasonality of crude mortality has been clearly documented and is primarily caused by increase in deaths in the elderly during winter.25,26 Van Asten et al. stated that winter peaks of all-cause mortality are often largely attributed to influenza and sometimes cold snaps, but other pathogens, such as respiratory syncytial virus, parainfluenza, and norovirus, may also play a substantial role in the mortality of the elderly.27
Our results are consistent with another Dutch study in which respiratory ICU admissions28 were compared with ILI incidence in primary care from 2007-2015.29 Its data indicate that in six of the nine seasons studied, increase in respiratory ICU admissions preceded ILI trends with a median time-lag of one week. In contrast to our results, a German study by Buda et al. found that the trend of SARI peaks closely matched the peaks for respiratory infections in primary care in the influenza seasons 2012-2016.30 Comparison with our study is difficult because of large differences in methodology and healthcare systems. SARI surveillance in Germany is based on ICD-10 codes related to SARI and the catchment population is not reported, which make incidence calculation and comparisons with our study impossible. In contrast to the German healthcare system, GPs have a gatekeeper role in the Dutch healthcare system and control, to a large degree, which patients are referred to the hospital.
Value of SARI surveillance
The finding that ARI incidence in secondary care peaks before ILI, ARI, or pneumonia in primary care in most respiratory seasons is important for SARI surveillance in terms of preparedness and emergency response.31,32 Timeliness is critical for detecting outbreaks and taking required public health action to reduce their size, ultimately leading to lower morbidity and mortality.31,33 For example, in a retrospective analysis, several clusters of hospital admissions for ARI were identified that occurred in 2005 to 2007, and earlier than the recorded Q-fever outbreaks in the Netherlands.34 In hindsight, a well-functioning SARI surveillance system might have led to earlier detection, and possibly earlier healthcare interventions, such as the treatment and follow-up of acute Q-fever patients, and implementing veterinary control measures. During the severe 2017/2018 influenza epidemic, a robust SARI surveillance system could have provided a timelier insight into the heavy burden on hospitals. This could have led to more timely healthcare measures, such as cohort isolation or the implementation of influenza point-of-care testing at the emergency department to improve patient flow.
The value of real-time SARI surveillance could be different between years, because SARI incidence is dependent on the severity of the respiratory year. In turn, the severity of the respiratory year is variable, depending on the type of circulating seasonal pathogen(s) and characteristics of patients most severely affected. We cannot draw conclusions on the predictive value of SARI surveillance, because this study is merely a descriptive study based on retrospective data. However, our results confirm the need for SARI surveillance data in the timely detection of future outbreaks and indicate that we cannot depend solely on primary care data.
Limitations
First, the absence of microbiological diagnostic results is an important barrier to interpreting incidence differences between ARI in secondary care, primary care consultations, and crude mortality. Data on microbiological test results would be needed to explain the whole spectrum of respiratory infections and to better understand the time-lag between the surveillance systems per season. For example, the influenza-related SARI could be more accurately defined and make comparisons with ILI more biologically plausible. Together with data on medical history, such as co-morbidities and place of residence, it could clarify which patient group is primarily reflected in the peak of ARI incidence in secondary care. In the setting of SARI surveillance, detection of causative pathogens is crucial in mitigating the effect of disease outbreaks by taking timely health care interventions.35-37 Other causative pathogens associated with influenza, and with high morbidity and mortality, could be added to the SARI surveillance system, such as Streptococcus pneumoniae, Staphylococcus aureus and Aspergillus spp (invasive pulmonary aspergillosis). High-quality SARI surveillance with laboratory-confirmed outcomes could also monitor the impact of vaccines and target healthcare interventions on specific risk groups.
A second limitation is that we used retrospective data to describe trends. Robust ‘real-time’ SARI-surveillance data are not yet available in the Netherlands. Third, incidence calculations for ARI in secondary care were based on one hospital in the western part of the Netherlands. Including only a tertiary hospital could have led to selection bias because these types of hospitals tend to have a different patient population than general hospitals. However, long-term historical data from other hospitals were not available to us. Fourth, by using province-based mortality data instead of catchment area-based data, our mortality calculations might have been overestimated to some extent. A possible explanation could be that the province-based mortality data included the city of Rotterdam, whose inhabitants are known to have lower life expectancy than the general Dutch population.38 Finally, this study used ‘acute respiratory infections in secondary care’ as a proxy for SARI patients because no distinction could be made between patients admitted to the hospital, reviewed at the outpatient clinic, or discharged home. This could have led to overestimation of incidence calculations.
CONCLUSION
This observational study demonstrates that routinely collected data can be used for describing trends of ARI in secondary care and may be suitable for near real-time SARI surveillance. The principal finding is that in most seasons, the incidence peaks for ARI in secondary care preceded the peaks in primary care and crude mortality with a considerable time-lag. This is relevant information for preparedness and emergency control. It would be of great value to add microbiological test results to the incidence data to better explain the difference in time-lag between these surveillance systems.
ACKNOWLEDGEMENTS
We acknowledge Statistics Netherlands for the mortality data used in this study. We would like to thank Ben Bom for his illustration of the LUMC catchment population.
DISCLOSURES
All authors declare no conflicts of interest. No funding or financial support was received.
*Supplementary materials are available from the authors upon request.
REFERENCES