KEYWORDS
Cut-off value, Graves’ disease, TRAb, TSH receptor antibody
INTRODUCTION
Graves’ disease is a frequent cause of hyperthyroidism which can be accompanied by goitre and/or eye disease (orbitopathy).1 The disease is caused by thyrotropin receptor autoantibodies (TRAb). These autoantibodies, present in almost 100% of patients with Graves’ disease, can stimulate the thyroid stimulating hormone (TSH) receptor and thereby cause hyperthyroidism.2 Detection of TRAb is important in the discrimination of Graves’ disease from other causes of hyperthyroidism. In addition to stimulating autoantibodies, certain TRAbs exhibit blocking or neutralising activity. Blocking TRAbs are less common but important to measure, as these antibodies can cause hypothyroidism,3 which can be accompanied by orbitopathy4 and myxoedema.5 TRAbs are present in 1-2% of healthy people and in 6-60% patients with Hashimoto disease.6 As TRAbs are diagnostic for Graves’ disease,7 guidelines recommend measurement of TRAbs in several patient groups. First, in patients with hyperthyroidism to determine the aetiology of thyrotoxicosis (the American Thyroid Association (ATA) Guideline8 and the Dutch Internist Association (NIV) guideline).9 Second, as TRAbs can cross the placenta and cause foetal hyperthyroidism, measurement is recommended in pregnant women that have or have had Graves’ disease (Dutch guideline of Obstetrics and Gynaecology, NIV guideline and International guideline for management of thyroid dysfunction during pregnancy).9-11 There are different types of assays that can measure TRAb levels: bioassays and bridge immunoassays specifically measure stimulating antibodies but not blocking antibodies, whereas competitive immunoassays cannot discriminate between stimulating and blocking antibodies. The latter are the most widely used within laboratories. Of note, even within this assay group, several rounds of optimisation in assay design have taken place, resulting in different assay generations that are incomparable in their measurement (for a complete description and overview see figure 1). Furthermore, as TRAb assays are not standardised (i.e., may be calibrated against different internationally recognised reference materials and/or differ methodologically), concentrations from assays of different companies are not easily comparable.12,13 Overall, due to several reasons, different assays are not comparable and therefore, clinically relevant cut-off values must be established for every method separately.
Recently, a third-generation fully-automated competitive immunoassay (Thermofisher, Phadia, Sweden) was introduced in our laboratory. This assay has been calibrated against the most recent reference standard (World Health Organization (WHO) standard 08/204). The manufacturer determined the cut-off value in an internal study (n = 400, including patients with Graves’ disease, Hashimoto’s thyroiditis, non-autoimmune thyroid diseases, and a variety of non-thyroid diseases).14 The group of Graves’ patients consisted of a mixture of patients that were newly diagnosed and patients that were under treatment. However, upon treatment with anti-thyroid drugs or surgery, TRAb concentration can decline. For example, after one year of anti-thyroid drug treatment, approximately 60% of the treated patients are negative for TRAb measurement.14 Treatment with RAI ultimately also leads to a decrease in TRAb concentration, although RAI can lead, in the first year, to an initial increase.15,16 In this study, the aim was to verify that the cut-off value established by the manufacturer also holds true in our population. Additionally, the aim was to study the influence of including treated Graves’ disease patients in the determination of the cut-off value, since TRAb measurement is primarily used for diagnostic purpose, and the cut-off value could be influenced by patients treated.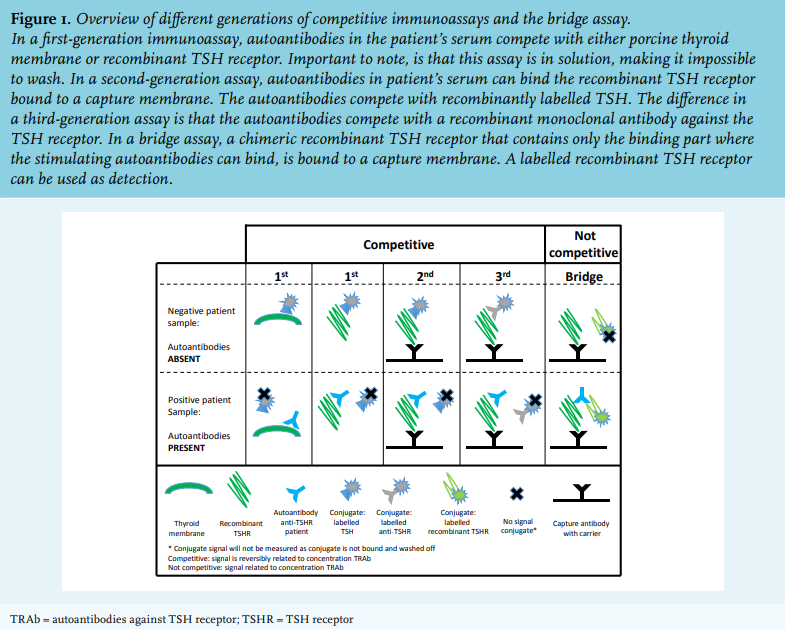
MATERIALS AND METHODS
Patients
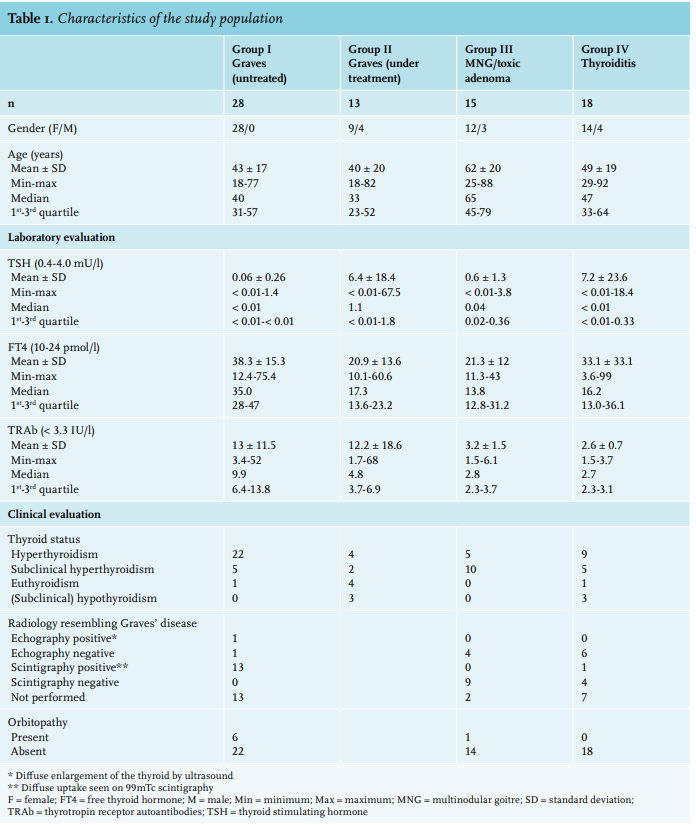
Samples used for retrospective analyses were from all patients referred for TRAb testing from February to April 2018 and November 2018 to January 2019 from two hospitals (Maasstad Hospital, Rotterdam and Spijkenisse Medical Centre, Spijkenisse, both in the Netherlands). For our study, we included patients that were newly diagnosed for the most frequent causes of hyperthyroidism and who fulfilled the following criteria: age > 18 years, not pregnant, seen by an internist, and no medical history of Graves’ disease. These 61 patients consisted of 28 patients with Graves’ disease, 15 with multinodular goitre or toxic adenoma, and 18 with thyroiditis. In addition, we included Graves’ patients that were under treatment with antithyroid drugs at the time of TRAb measurement. Treatment was either monotherapy thiamazole or in combination with thyroid hormone (the so-called block and replace therapy). Graves’ disease was diagnosed according to both the NIV guideline9 and the comparable American guideline.8 More specifically, the diagnosis was based on the presence of (subclinical) hyperthyroidism, with clinical context including presence of orbitopathy and diffuse uptake as seen with 99mTc scintigraphy, or diffuse enlargement of the thyroid by ultrasound. The criteria for Graves’ disease were presence of (subclinical) hyperthyroidism, clinical symptoms fitting Graves’ disease, and positive TRAb. Of note, as the aim of this study was to determine the cut-off value for the TRAb assay; 6/7 patients with TRAb concentrations below 6 IU/l had, in addition to (subclinical) hyperthyroidism, scintigraphy results resembling Graves’ disease. In one patient with TRAb concentration of 4.5 IU/l, radiography was not performed. This patient was diagnosed with Graves’ disease because clinical follow-up of treatment matched Graves’ disease, the typical age (30 years), and absence of palpable nodes in the thyroid. The study was approved by the local medical ethical committee.
Methods
Samples were measured with a third-generation competitive immunoassay: EliA-anti-TSH-R well (Thermofisher Scientific, Phadia, Sweden). The method is based on the competition of the autoantibody with a monoclonal antibody against the TSH receptor labelled with beta-galactosidase. This method is standardised against the most recent WHO standard 08/204. According to the manufacturer, the interval of 2.9-3.3 IU/l is referred to as grey zone area and a concentration above 3.3 IU/l is considered positive. The total coefficient of variance (CV) was established by determination of the within run and between run CV of three samples with different concentrations of TRAb. The within run resembles the analytical variation based on multiple measurements of the same sample within one run. The between run variation resembles the analytical variation of the same sample measured on different days. Between run and within run CV were calculated by duplicate measurements of the same sample in 10 different runs on five different days using a common laboratory procedure protocol for the determination of random error using the EP evaluator version 12 software (Data Innovations LLC, South Burlington, VT, USA).
Statistical analysis
The distribution of TRAb results showed non-Gaussian distribution, therefore the results are presented as median and interquartile range. In order to determine the optimal cut-off value, receiver operating characteristics (ROC) curve analysis was performed with EP evaluator version 12 software. This analysis revealed the percent efficiency: the percent of all results that are classified correctly (the true positives and true negatives). The optimal cut-off value was determined as the cut-off value with maximal percent efficiency.
RESULTS
Description of the population
Characteristics of the different study groups are summarised in table 1. The whole patient group consisted of more women (85%, n = 63) than men (15%, n = 11). All patients with Graves’ disease were women. Patients with Graves’ disease presented with hyperthyroidism, as observed by median concentrations of TSH and FT4, whereas the TSH and FT4 median concentrations in patients treated for Graves’ disease resembled normal thyroid function tests. Almost all (14/15) newly diagnosed Graves’ patients had either ultrasound or thyroid scintigraphy results compatible with Graves’ disease. Of note, one patient did not show signs of Graves’ disease on ultrasound, and scintigraphy was not performed. Although Graves’ disease is not always detected by ultrasound, it is the overall clinical picture that the clinician considers to determine a diagnosis; this patient was diagnosed with Graves’ disease because of the presence of orbitopathy. As expected, the median concentration of TRAb was higher in newly diagnosed patients compared to patients under treatment (median TRAb 9.9 IU/l compared to 4.8 IU/l, respectively). Patients with multinodular goitre and thyroiditis presented with subclinical hyperthyroidism (median TSH for both < 0.06 mU/l, median FT4 in normal range). Both groups had negative (< 2.9, based on cut-off value of manufacturer) median TRAb concentrations. When radiology was performed, almost all (22/23) had ultrasound or scintigraphy results not resembling Graves’ disease. The patient that had a scintigraphy resembling Graves’ disease had diffuse thyroid uptake of radioactive iodine. This image is typical for Graves’ disease, but can also be seen for patients with thyroiditis. This patient had typical clinical symptoms resembling thyroiditis as within one month, the patient developed hypothyroidism. After half a year, the patient was symptom free with normal thyroid function.
Random error: coefficient of variance
We determined the within run, between run, and total CV (Supplementary table 1). The CV increases with decreasing antibody concentrations, and is relatively high in the lower concentrations. The sample with a TRAb concentration of 2.2 IU/l had a total CV of 26.4%, whereas at 9.6 IU/l, the total CV was 16.7%. According to the manufacturer, the CV at the cut-off value 3.3 IU/l is 15%, but at 2.9 IU/l > 20%. 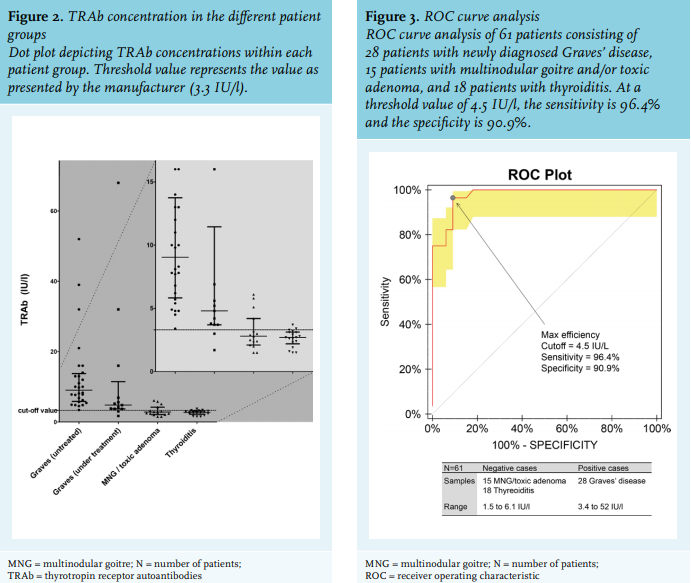
TRAb assay: grey zone and cut-off value
We analysed the TRAb concentration in all different patient groups (figure 2). When the manufacturer’s cut-off value of 3.3 IU/l was used as positive for TRAb, all Graves’ disease patients were positive for TRAb. Of all Graves’ disease patients that received treatment (mostly block and replace treatment), 85% (n = 11) scored positive for antibodies. Median value of TRAb concentration of multinodular goitre and toxic adenoma patients was negative, 2.8 IU/l. However, four patients (27%) scored positive with TRAb concentration ranging from 4.2-6.1 IU/l. One possibility might be that these patients have a combination of multinodular goitre and Graves’ disease. Of all thyroiditis patients, the majority (16/18) had negative TRAb, whereas 11% (2/18) scored positive for antibodies. However, TRAb concentration was relatively low (TRAb concentration of 3.4 and 3.7 IU/l, respectively). All data from the patient groups, excluding Graves’ disease patients under treatment, were plotted in an ROC curve. ROC curve analysis showed that the most accurate threshold value for this cohort is 4.5 IU/l (figure 3). This cut-off value is higher than the threshold value proposed by the manufacturer, implying that the upper limit of the grey zone should be 4.5 IU/l instead of 3.3 IU/l. Of note, none of the Graves’ patients were in the grey zone defined by the manufacturer, whereas 1/5 patients had Graves’ disease in the newly defined grey zone (table 2).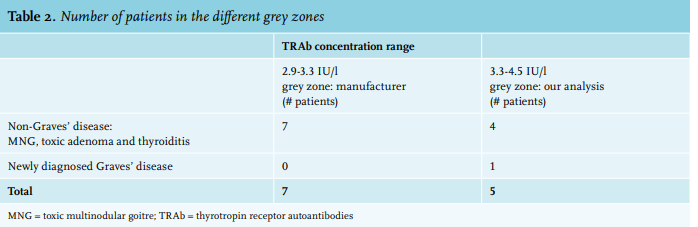
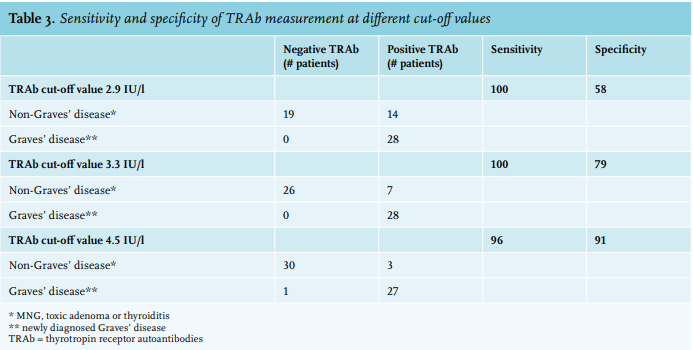
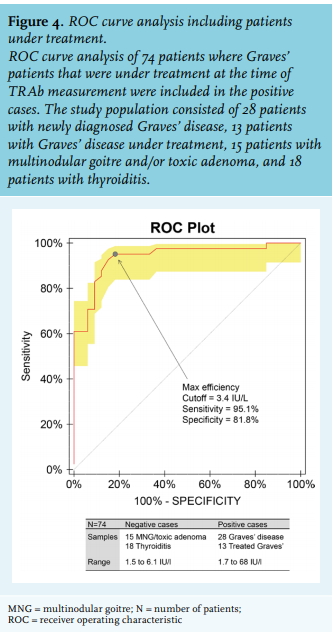 We determined the sensitivity and specificity of the different cut-off values: 2.9 IU/l (lower limit of the grey zone proposed by the manufacturer), 3.3 IU/l (cut-off for positivity of the manufacturer), and 4.5 IU/l (cut-off for positivity based on our study population). Applying a cut-off value of 4.5 resulted in a sensitivity of 96% and specificity of 91%, compared to a sensitivity of 100% and a specificity of 79% when the cut-off value of 3.3 IU/l was used (table 3). The influence of including patients under treatment on the cut-off value was determined by adding patients under treatment to the group of newly diagnosed Graves’ patients. This revealed a cut-off value of 3.4 IU/l, comparable to the one established by the manufacturer (figure 4).
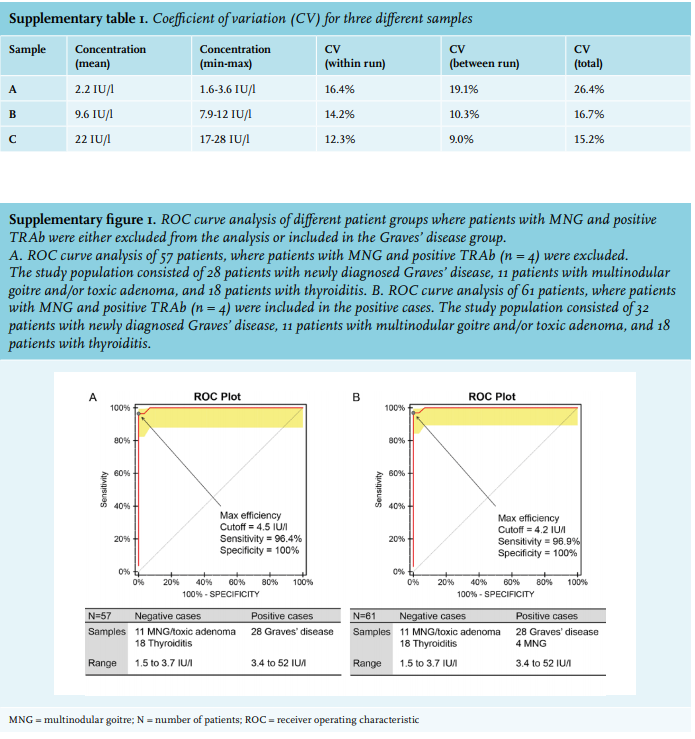
One important issue is that, four patients with multinodular goitre, had positive TRAb concentrations which could be explained by the co-existence of Graves’ disease. TRAb concentrations of these patients ranged from 4.2 to 6.1 IU/l. This is in agreement with data from another study, where several patients with MNG scored positive for TRAb.17 To exclude that the cut-off value was influenced by these four patients, we repeated the ROC curve analysis without these four patients. This did not change the cut-off value of 4.5 IU/l (Supplementary figure 1A). Analysis of the data with these four patients in the Graves’ disease group however, revealed a cut-off value of 4.2 IU/l (Supplementary figure 1B). This cut-off value is still higher than that established by the manufacturer. Overall, the grey zone area and the cut-off value based on newly diagnosed Graves’ patients is higher in this patient cohort than the one from the manufacturer.
DISCUSSION
As shown in this study, TRAb is clearly increased in untreated Graves’ patients, lower in treated Graves’ patients, and marginally increased or even absent in patients with multinodular goitre and thyroiditis. Our analysis revealed that excluding patients under treatment results in a higher cut-off value for TRAb positivity (4.5 IU/l compared to 3.3 IU/l, as recommended by the manufacturer). As TRAb concentrations are primarily used to establish the diagnosis of Graves’ disease, extending the grey zone to 4.5 IU/l is probably more appropriate and will more accurately discriminate between Graves’ disease and non-Graves’ disease causes of hyperthyroidism. Reference values are usually established by measuring samples in a group of ostensibly healthy individuals according to laboratory guidelines,18 which recommends inclusion of > 120 people per group. However, this is not feasible for all patient categories. Therefore, laboratories sometimes try to calculate their cut-off values based on method comparison studies. In less well-standardised tests this is more challenging. Moreover, here the clinical application and discriminating capability of the test to differentiate between different causes of hyperthyroidism is more relevant. Therefore, ROC curve analysis was applied as was performed in previous studies. Our analysis revealed a cut-off value of 4.5 IU/l, with 96% sensitivity and 91% specificity. The sensitivity and specificity are comparable to other assays,19 whereas the cut-off value of 3.3 IU/l proposed by the manufacturer had 79% specificity, much lower compared to other assays.19 Of note, the cut-off value of 3.3 IU/l had 100% sensitivity. However, although extremely rare, some Graves’ patients have negative TRAb concentrations, sometimes even below 2.9 IU/l.20 Therefore, aiming for a cut-off level with 100% sensitivity is not favourable. Extending the grey zone is agreement with findings of another study by Villalta et al. that identified a cut-off value of 3.8 IU/l.21 As mentioned above, the manufacturer determined the threshold in an internal study (n = 400, including patients with Graves’ disease, Hashimoto’s thyroiditis, non-autoimmune thyroid diseases, and a variety of non-thyroid diseases).14 The group of Graves’ patients consisted of a mixture of patients that were newly diagnosed and patients under treatment. Of note, in our study population, if we combine treated and newly diagnosed Graves’ patients, the cut off value was 3.4 IU/l, comparable to the manufacturer’s (figure 4). As shown in figure 2 and consistent with other studies,15 patients under treatment have lower antibody concentrations, suggesting a possible explanation for the observed difference in cut-off values found by Villalta et al. and us, compared to the manufacturer’s cut-off. One advantage of implementing a higher cut-off value is that the variance around the threshold concentration will be lower as the CV decreases with increasing antibody concentrations. This is important as measurements with a concentration near the threshold value should be as precise as possible to limit the number of false positives and false negatives. In this study, we have shown that the analysed assay (Thermofisher Scientific, Phadia) has a relatively high CV, with CV > 20% at a concentration below the threshold. Using the reported variation by the manufacturer, 15% at cut-off value, this means that cut-off value of 3.3 IU/l can range from ~ 2.3-4.3 IU/l (95% confidence interval). This is also important as some patients with thyroiditis had positive TRAb. However, these patients showed TRAb concentrations within in the 95% confidence interval of the cut-off value. Therefore, the positive results of these patients with thyroiditis are uncertain because of the measurement variation. The complexity of the diagnosis of Graves’ disease includes two aspects. First, the absence of consistent recommendations on how to diagnose Graves’ disease. Second, clinical symptoms and imaging tools cannot always solely be used to diagnose Graves’ disease and there is no single feature to discriminate Graves’ disease from other causes of hyperthyroidism. For example, diffuse uptake on a scintigraphy fits the diagnosis of Graves, whereas this feature can also resemble recovering thyroiditis. Therefore, it is the clinician’s overall judgement - which can include clinical follow up - that determines the diagnosis. The difficulty to discriminate Graves’ disease from other causes of hyperthyroidism underscores the importance of TRAb measurements. Along those lines, this also emphasises the importance of using correct cut-off values for TRAb assays, as most diagnoses in clinical practice are dependent on the outcome of this assay. One limitation of this study is that, as arguments for diagnosis may include positive TRAb, selection bias cannot be excluded. However, 6/7 patients with antibody concentrations below 6.0 IU/l showed radiography results resembling Graves’ disease. Another question that arises is: which assay should be used to measure TRAb? Assays that measure TRAb are mainly divided into three categories: 1) competitive immunoassays are assays in which the autoantibodies in the patient’s serum compete with either recombinant TSH or a monoclonal antibody against the TSH receptor. Within this assay group, different generations exist and all cannot discriminate between stimulating and blocking antibodies. Of note, this leads to one limitation of this assay category: if another cause of hyperthyroidism is present, there is a possibility of misdiagnosing Graves’ disease in a patient with blocking antibodies. 2) Bioassays in which cyclic adenosine monophosphate production is detected upon incubation with a patient’s serum. These assays specifically measure stimulating antibodies, not blocking antibodies. 3) Recently developed bridge immunoassays are assays designed to specifically measure stimulating antibodies. As hyperthyroidism in Graves’ disease is caused by stimulating antibodies one could argue that the novel bridge assays are best to use.22 However, bridge assays cannot be used for all patient groups. For example, in pregnant women, presence of TRAb predicts the chance of thyroid dysfunction in the foetus.4 In this specific setting, blocking antibodies are also relevant since they can cause hypothyroidism of the foetus. Another complicating factor is that it is possible that patients switch between stimulating and blocking antibodies.23 Therefore, it is not recommended to measure only stimulating antibodies in patients with known stimulating antibodies. When using guidelines, it is important to realise that thresholds mentioned in these guidelines cannot be applied uniformly by all laboratories. For example, the Dutch guideline for obstetrics and gynaecology recommends monitoring of the foetus when TRAb concentrations in pregnancy are above 5-10 IU/l.10 This threshold is based on a method from the 1990s that is no longer widely used in the Netherlands. As explained above, different assays are not comparable. The international guideline recommends monitoring when the TRAb concentration is more than 2-3-fold above the threshold.11 This type of recommendation is more suitable; however, any new assay requires determination of relevant cut-off values for different patient groups. Reference values cannot be calculated from another method by a simple formula due to lack of standardisation among assays. In conclusion, the cut-off value of a TRAb assay should be based solely on newly diagnosed patients, excluding patients under treatment. For this immunoassay, the grey zone proposed by the manufacturer should probably be extended in untreated Graves’ patients. Lastly, clinical context and expertise of the clinician remain crucial in the workup of patients with possible Graves’ disease.
ACKNOWLEDGEMENTS
The authors thank G. Verloop and K. v.d. Laan for their contribution to the TRAb measurements.
DISCLOSURES
All authors declare no conflicts of interest. No funding or financial support was received.
REFERENCES