KEYWORDS
Acute leukaemia, quality indicator, standardised mortality ratio (SMR)
INTRODUCTION
For several years there has been a growing interest in measuring performance and quality of health care. Hospital performance can be assessed using various quality indicators. One of the quality indicators used by the Health Care Inspectorate in the Netherlands is the Hospital Standardised Mortality Ratio (HSMR), which is the ratio of observed and expected number of deaths in a specific hospital.1 In order to compare hospital performance on the basis of mortality rates, these rates have to be adjusted for casemix: differences in characteristics of the patients admitted to those hospitals. The HSMR is composed of 50 diagnosis groups. For each group, it is determined which characteristics (retrieved from the National Medical Registry [LMR]) influence the mortality rate. The standardised mortality ratio (SMR) is the adjusted mortality ratio for the varying diagnosis groups.2,3 The use of the HSMR and SMR as a quality indicator is subject to much criticism. It is stated that the registration and coding of the data by the hospitals is often inconsistent and incomplete, which can influence the HSMR of the respective hospitals.4 The 50 diagnosis groups on which the HSMR is based cover 80% of the total hospital mortality. As a consequence, 20% of all deaths will be excluded from analysis.5 Adjustment of the (H)SMR is based on variables registered in the LMR, and therefore insufficient, since factors not registered in the LMR cannot be accounted for.3
The HSMR was first published in the Netherlands in 2011. In addition, the SMR for each diagnosis group was calculated. SMR data were not published, but only disclosed within the varying hospitals. Internal disclosure of the SMR of the diagnosis group leukaemia showed a significant difference in SMR among the six Santeon hospitals. In one of the Santeon hospitals, the SMR was used to express the quality of leukaemia treatment. This was the reason to study the value of the SMR within the diagnosis group leukaemia, specifically in the group of patients with acute leukaemia, and to relate it to a clinically valuable measure of outcome: the five-year overall survival. We wanted to gain insight into the cohort of patients diagnosed with acute leukaemia, the percentage of patients who were actually treated within the respective hospitals, the type of treatment the patients had undergone and for which variables the SMR had been adjusted.
MATERIALS AND METHODS
Patient selectionData of all patients with acute leukaemia, who were admitted to one of the six Santeon hospitals in the period 2005-2009, were collected retrospectively. Patients were identified using a database generated by Statistics Netherlands (CBS), a database used for the SMR calculation of the diagnosis group leukaemia. For the purpose of our analysis, only patients with the ICD-9 code ‘acute lymphoblastic leukaemia’ (204.0); ‘acute myeloid leukaemia’ (205.0); ‘acute monocytic leukaemia’ (206.0); ‘other specified leukaemia’ (207.0) or ‘leukaemia of unspecified cell type’ (208.0) were selected. For each patient, the diagnosis of acute leukaemia was confirmed. Furthermore, data concerning year and month of diagnosis, risk classification, type of treatment, survival status and date of death were collected using the electronic health record system (EHRS). If, according to registration in the EHRS, the patient was alive, this was confirmed via the general practitioner. If data were missing in EHRS, the medical record was reviewed. Patients with chronic leukaemia, other haematological malignancies and children were excluded.
Statistics
Patient characteristics were described based on frequencies and means. Differences between groups were compared using the Pearson chi-square test (discrete variables) or one-way ANOVA test (continuous variables). Differences with a p-value < 0.05 were considered statistically significant. The overall survival was estimated using the Kaplan-Meier method. Univariate analyses were carried out using the log-rank test. Variables affecting overall survival (OS) (p < 0.1) were included in a multivariate Cox regression analysis. P-values were calculated from the regression models with the Wald test. The analysed variables were: age; urgency of the admission; source (indicating the patient’s residence before admission); comorbidity (Charlson index) and year of discharge. This was in accordance with the SMR analysis for the diagnosis group leukaemia. In addition, the impact of the other HSMR variables (sex, socio-economic status and month of admission) and the impact of centre of treatment was examined.
The SMR of a hospital h for diagnosis d was defined as SMRdh = 100 x (observed mortality)dh / (expected mortality)dh. The numerator was the observed number of deaths with main diagnosis d in hospital h. The denominator was the expected number of deaths for this type of admission under the assumption that individual mortality probabilities (per admission) do not depend on the hospital, i.e. are equal to mortality probabilities of identical cases in other hospitals. Confidence intervals of the SMRs were calculated. For each diagnosis d, the average SMR across hospitals is equal to 100. A lower limit above 100 referred to a statistically significant high SMR and an upper limit below 100 referred to a statistically low SMR.3 The SMR of acute leukaemia was compared with the OS of this cohort of patients. The calculations were performed by using SPSS version 19.0 (IBM Corp., Armonk, NY USA).
RESULTS
Patient selection
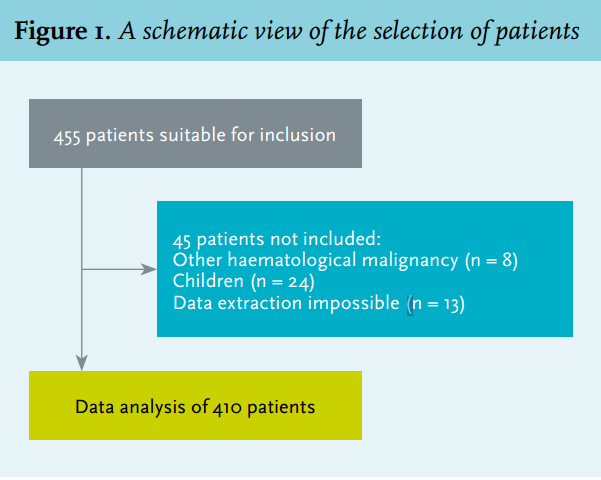
In the period 2005-2009, 455 unique patients were admitted for treatment of acute leukaemia in the Santeon hospitals.
A total of 410 patients met the inclusion criteria, 45 patients were excluded (9.9%). Figure 1 shows a schematic view of the selection of patients.
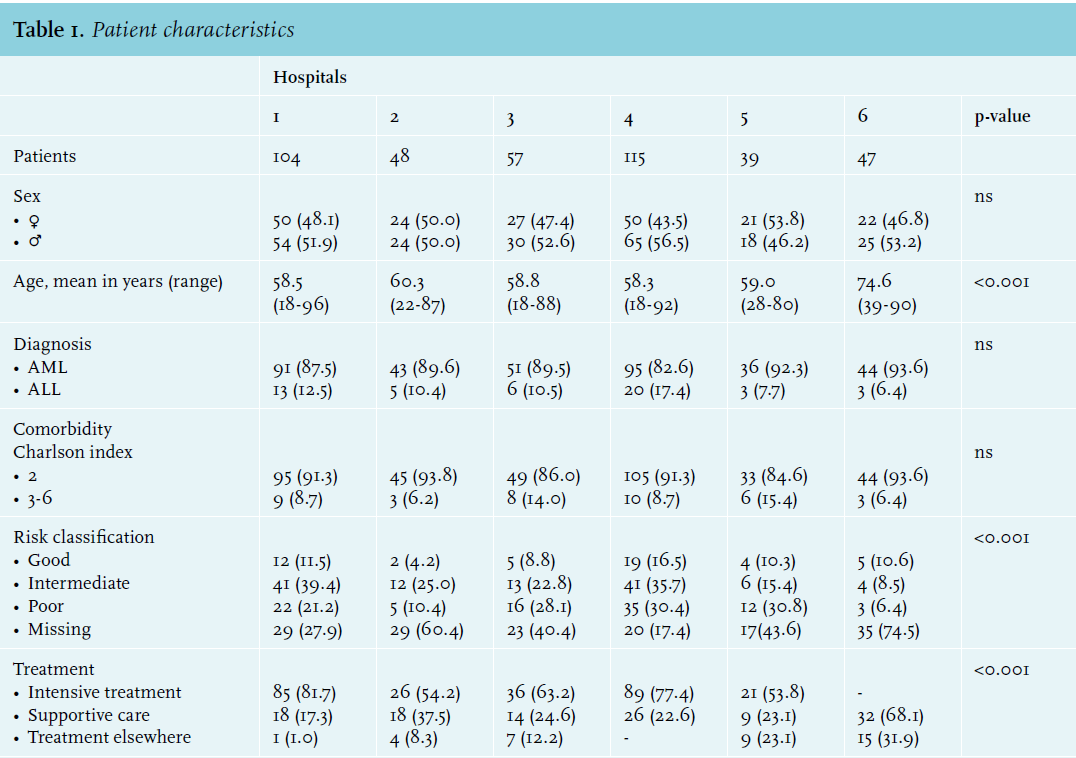
Patient characteristics
Patient characteristics are shown in table 1. The mean age in hospital 6 was significantly higher compared with the other hospitals (p < 0.001). There were significant differences in the risk classification and treatment between hospitals (p < 0.001). In hospital 6, no intensive treatment was performed. In addition, risk classification was lacking in 74.5% of the patients in this hospital. This was probably related to the high mean age and the lack of therapeutic consequences. There was no significant difference in sex and comorbidity between hospitals.
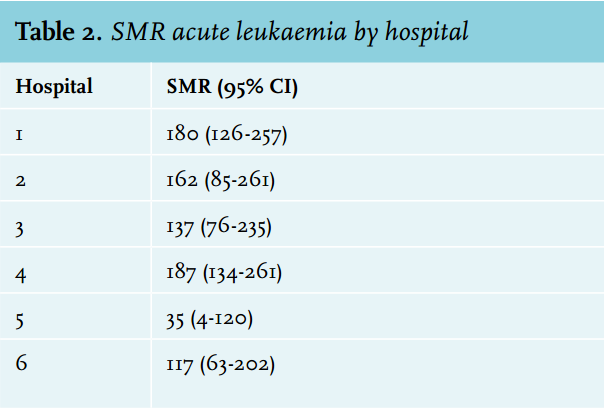
Analysis SMR
The calculation of the SMR for the diagnosis group acute leukaemia in the period between 2005-2009 was based on 992 admissions. The data from these admissions were used to calculate the SMR in the cohort of patients who had actually been treated in the respective hospital. Hospital 5 had a low SMR in comparison with the national average, the other hospitals had a high SMR; however, this was only significant for hospitals 1 and 4 (180 [CI 95%: 126-257] and 187 [CI 95%: 134-261]) respectively. Table 2 gives an overview of the SMR values for the diagnosis group of acute leukaemia in the different hospitals.
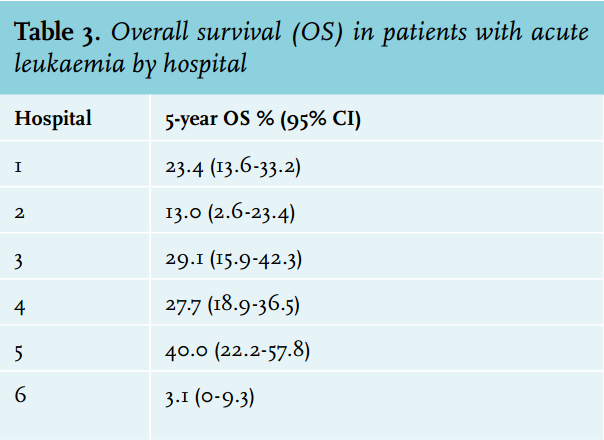
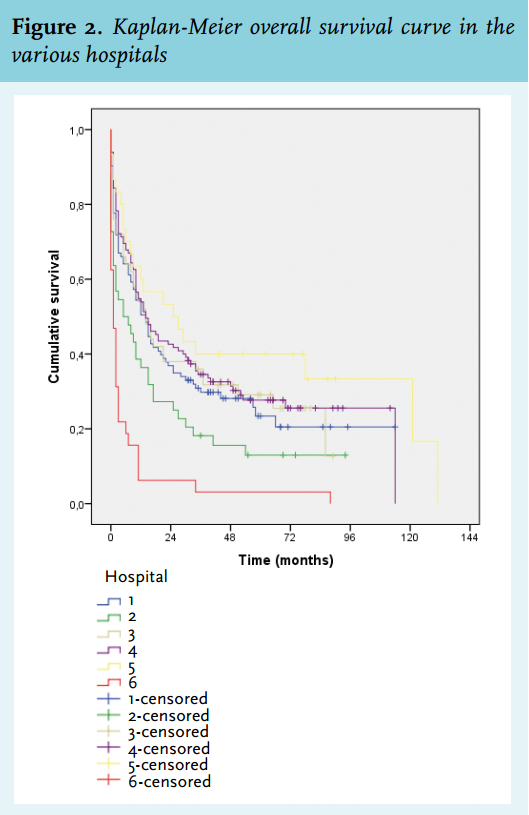
Analysis overall survival
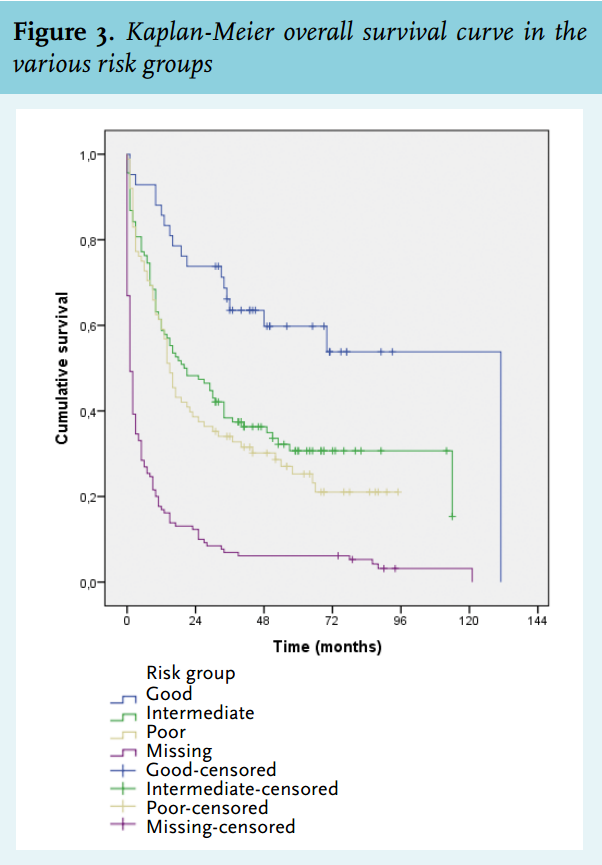
The analysis of the OS of patients with acute leukaemia per hospital was performed in the cohort of patients who had actually been treated in the respective hospital. Table 3 shows the five-year OS per hospital. The five-year OS was significantly different between the six hospitals, with hospital 2 and 6 showing the lowest survival (p = 0.032). Figure 2 shows the corresponding Kaplan-Meier curves. Furthermore, the impact of cytogenetic risk classification was analysed. Patients in the good-risk group had a better OS than patients in the intermediate- or poor-risk group, as expected (p = 0.013). In the group of patients for whom data regarding risk classification were lacking, the lowest survival was seen. The OS in the different risk groups is shown in figure 3.
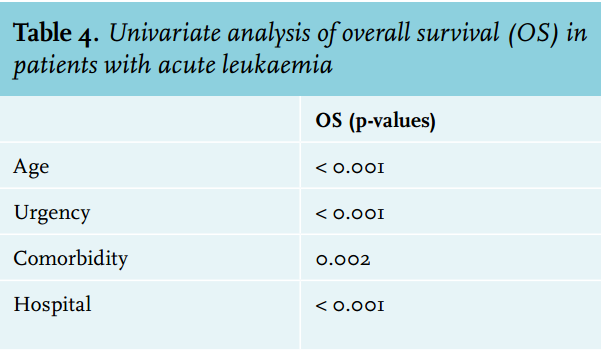
Univariate analysis
Table 4 shows that after the univariate analysis variables: age (p < 0.001); urgency of admission (p < 0.001); comorbidity (p = 0.002) and hospital (p < 0.001) showed an effect on OS.
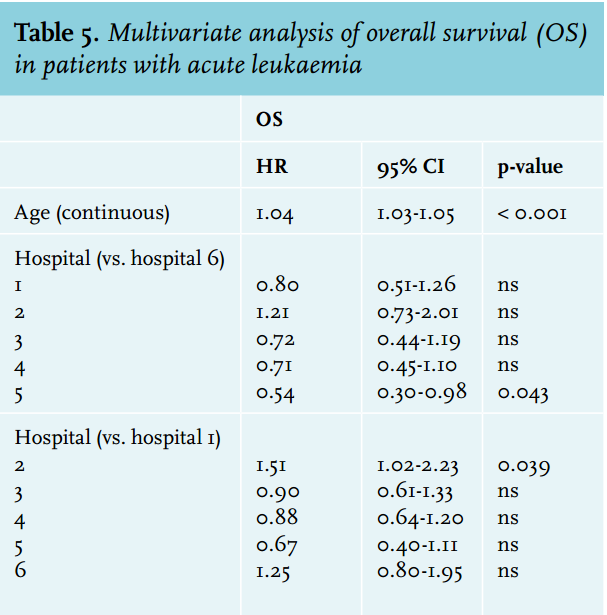
Multivariate analysis
Table 5 shows the results after multivariate analysis. Reviewing the variables used in the analysis of HSMR as well as SMR, age (per increase of one year; HR 1.04; CI 95% 1.03-1.05; p < 0.001) and hospital (p = 0.032) were the only significant variables that had an impact on the OS.
DISCUSSION
The objective of this study was to examine the value of the SMR as a quality indicator for the treatment of acute leukaemia. To this end, we compared the SMR with overall survival of acute leukaemia. We show a discrepancy between measurement of performance according to SMR as compared with measurement of performance according to overall survival. Qualified by SMR, hospital 1 and 4 had the lowest performance, while qualified by OS hospital 2 and 6 showed the lowest performance. This study shows that the use of the SMR as a quality indicator for the treatment of acute leukaemia does not appear to be justified. Several potential explanations exist for these differences. Firstly, the (H)SMR is a mortality probability per admission, while hospitals may differ in their admission and discharge policy during the treatment of acute leukaemia. This may affect the in-hospital mortality rate.3,5 For example, intensive chemotherapy is regularly given during an admission of 4-6 weeks. However, several hospitals have currently adopted intensive treatment procedures in a combined inpatient and outpatient setting or outpatient setting only. In addition, during the palliative phase of treatment, the availability of terminal care facilities in the neighbourhood may affect the timing of discharge. Secondly, the SMR may be influenced by the performance of high-risk interventions or procedures, since adjustment for such procedures is lacking.6 In case of acute leukaemia, autologous stem cell transplantation is part of the first-line treatment protocols, which only level B hospitals are allowed to perform in the Netherlands. Our study showed that specifically hospitals accredited to perform autologous stem cell transplantations had a high SMR. This may have been a consequence of insufficient adjustment. Furthermore, the SMR shows the in-hospital mortality, which does not necessarily reflect the performance of a hospital with respect to treatment of acute leukaemia. In-hospital mortality is sometimes an expected and accepted outcome when patients are admitted for palliative care.5 The ratio of in-hospital (40-65%) and out-hospital mortality is influenced by geographical factors. It also reflects the availability of terminal care facilities in the neighbourhood.3,5,7
One of the main limitations of this study is the retrospective design. Adjustment for casemix was based on data from the LMR. Variation in the coding of data in this registry may lead to inconsistencies and thus negatively influence the reliability of the SMR. Furthermore, it is possible that patients were missed during data collection, for example because they had an incorrect ICD-9 code. In addition, the calculation of the SMR for the subgroup ‘acute leukaemia’ is based on the expected mortality for the diagnosis group ‘leukaemia’. This may have had a slight impact on the SMR for the diagnosis group ‘acute leukaemia’. Finally, the number of patients in the varying hospitals is relatively small, which may have affected the reliability of both the SMR and the survival analysis.
Nevertheless, we conclude that the SMR should not be used as a quality indicator for the treatment of acute leukaemia. Differences in the SMR cannot be solely attributed to differences in the quality of care between hospitals. This study and the existing literature on this subject show that standardisation for the possible variables is insufficient.8,9 The most important critique is the use of hospital mortality as a quality indicator for the treatment of a disease. The outcome of acute leukaemia treatment is the result of in-hospital, day-care and outpatient treatment. In the SMR analysis, mortality is restricted to in-hospital mortality, while in-hospital care reflects just part of the treatment for acute leukaemia.
ACKNOWLEDGEMENTS
We wish to thank Birgit Witte (Department of Epidemiology and Biostatistics, VU University Medical Centre) for the statistical assistance. The abstract of this manuscript has been presented at the 7th Dutch Haematology Congress at January 24th 2013 in Papendal, Arnhem.10
DISCLOSURES
The authors declare no conflicts of interest. No funding or financial support was received.
REFERENCES