DIAGNOSIS 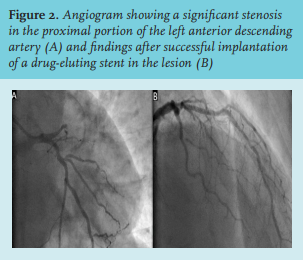
The patient’s ECG shows sinus rhythm and ST-segment depression in leads V2 to V6 associated with tall, positive and symmetrical T waves, while there is also an approximately 1mm ST-segment elevation in lead aVR. This pattern (described as the De Winter pattern) in conjunction with the patient’s presentation, is highly suggestive of an acute occlusion of the left anterior descending (LAD) artery.1 Given these data, he was referred for emergency cardiac catheterization, which showed an occlusion of the proximal LAD artery and moderate disease of the right coronary artery (figure 2A).
The LAD artery lesion was treated with a drug-eluting stent (figure 2B) and the patient was subsequently asymptomatic. His remaining hospitalisation was uneventful, as he reached a peak high sensitivity cardiac troponin T (hs-cTnT) level of 10000 ng/l, and his echocardiogram showed a mildly reduced left ventricular systolic function.
This case highlights the paramount importance of recognizing an early and acute ECG pattern in a patient with typical chest pain. This pattern, first described by De Winter et al. in 2008, consists of ST-segment upsloping depression in the pre-cordial leads in association with tall, positive, and symmetrical T waves and in most cases, with slight ST-segment elevation in lead aVR.1 This specific pattern was noted for being associated with an acute LAD occlusion, and whilst a recent systematic review has underlined its positive predictive value for an acute coronary artery occlusion,2 its mechanism is still not fully ascertained.1,3,4 Among the mechanistic explanations for this peculiar phenomenon, subendocardial ischaemia (at an hyperacute stage of the infarction, before transmural ischaemia becomes predominant) with ensuing subendocardial action potentials has presented an attractive hypothesis.3,4,5 In the absence of significant collateral circulation (as in this case), downregulation of myocardial metabolism presents an important mechanistic pathway.5 Interestingly, while this patient’s ECG already showed the classical De Winter pattern, his hs-cTnT level at admission was only 8 ng/l (within the normal range), thus attesting to the acute nature of his presentation. Additionally, albeit showing prominent T waves (one of the hallmarks of this pattern), his potassium levels were within the normal range.
In conclusion, the knowledge of the De Winter pattern is pivotal to those working with acute chest pain patients. Its identification is of interest, in order to allow for an expedite differential diagnosis among those who present with acute chest pain.
REFERENCES