KEYWORDS
Demography, euthanasia, physician-assisted death, physician-assisted suicide, regional variation
INTRODUCTION
Euthanasia and physician-assisted suicide – together physician-assisted death – were legalised in the Netherlands in 2002, after having been permitted in ethical debates, law cases, and medical practice since the 1980s. A physician who provides euthanasia or assists in suicide is exempted from prosecution under several legally prescribed conditions. The physician should be convinced that the patient has made a voluntary and well-considered request and that his suffering is unbearable without a prospect of improvement. He should, additionally, inform the patient about the situation and prospects, conclude with the patient that no reasonable alternatives exist, consult at least one independent physician, and perform the euthanasia or assisted suicide with due medical care. The physician should report each case of euthanasia or assisted suicide to a Regional Review Committee, which consists of a physician, a jurist, and an ethicist and assesses whether the conditions have been met. The decision of a Regional Review Committee that the physician has complied with the conditions is final. If a Regional Review Committee decides that the physician has not complied with the conditions, the case is transferred to the Public Prosecutor, who decides about prosecution.1
The number of reported cases of euthanasia and physicianassisted suicide in the Netherlands has risen from 1882 in 2002 to 5306 in 2014, which is 1.3% to 3.8% of all deaths.2 The practice of euthanasia and physician-assisted suicide and the developments in their practice in the Netherlands have been compared with those in other countries.3-5 However, possible regional differences in the practice and the developments within the Netherlands have not been studied.
The Netherlands has been divided into five regions, in each of which a Regional Review Committee attends to the reported cases of euthanasia and physician-assisted suicide. The five Regional Review Committees jointly publish annual reports which describe and discuss the cases of euthanasia and physician-assisted suicide that have been assessed and count the numbers and characteristics of these cases per region. The annual reports thereby enable the comparison of the practice of euthanasia and physician-assisted suicide between the regions. In this study, we use these data to regionally compare the frequencies, characteristics, and trends of euthanasia and physician-assisted suicide since their legalisation in the Netherlands. We try to explain regional differences by demographic, socioeconomic, and health-related differences between the regions.
METHODS
Regions of the Regional Review Committees
The five regions of the Regional Review Committees correspond to groups of provinces. Region 1 includes the provinces Groningen, Friesland, and Drenthe. Region 2 includes Overijssel, Gelderland, Utrecht, and Flevoland. Region 3 includes only North Holland. Region 4 includes South Holland and Zeeland. Region 5 includes North Brabant and Limburg. Since 2012, the Dutch legislation on euthanasia and physician-assisted suicide also applies to the Dutch Caribbean islands Bonaire, Saba, and Saint Eustatius. Cases from these islands are assessed by the Regional Review Committee of Region 1. These islands were not included in the analyses, because only one case has been reported from there.
Euthanasia, physician-assisted suicide, non-assisted suicide, and other deaths
Data on the frequencies, characteristics, and trends of euthanasia and physician-assisted suicide in the five regions have been made publicly available in the annual reports of the Regional Review Committees.2 From these reports we derived, for each year and each region, the numbers of reported cases of euthanasia and physicianassisted suicide, the numbers of specialties of the reporting physicians, the numbers of the locations where the reported cases were carried out, and the numbers of the disorders underlying the reported cases.
We derived the numbers of non-assisted suicide, for comparison, and the numbers of all deaths, as totals and stratified per underlying disorder, for each year and each province, from the StatLine Databank of the Central Bureau for Statistics.6 We summed these numbers for each group of provinces that constitute one of the five regions of the Regional Review Committees.
Demographic, socioeconomic, and health-related data
We derived demographic, socioeconomic, and health-related data for each year and each province from the StatLine Databank.6 We averaged each variable for each group of provinces that constitute one of the five regions of the Regional Review Committees weighed by the numbers of inhabitants, households, or voters in the provinces. We categorised the variables in eight groups. One group contained the percentages of women and of inhabitants aged 45 to 65, 65 to 80, and 80 years and older. A second group contained the percentage of divorced inhabitants, the percentage of widowed inhabitants, the percentage of households consisting of one person, the percentage of households with children, and the average number of inhabitants in a household. A third group contained the percentage of non-Western immigrants. A fourth group contained the percentages of inhabitants who were unemployed, who were disabled from employment, who were on social welfare, the average income standardised for differences in household composition, the number of legal bankruptcies, the percentages of inhabitants with intermediate education, and with higher education. A fifth group contained the average distances to the nearest general practitioner, hospital, library, cinema, and swimming pool. A sixth group contained the percentages of Roman Catholics, Protestants, and Muslims. A seventh group contained the percentages of votes for political parties in the national parliament, whereby Christian parties apart from the Christian Democratic Appeal, parties for elderly, and right-wing protest parties were categorised jointly and other parties that never obtained parliamentary seats were excluded. An eighth group contained the number of hospital admissions per 10,000 inhabitants per ICD-10 category of disorders.
We derived additional data from the StatLine Databank6 for each province on self-reported health collected by the population-sample Health Questionnaire Study spanning the years from 2008 through 2011. These data include prevalences of lifestyle-related risk factors, physical and psychological complaints, medical disorders, health care use, medication use, and general health experience. We averaged each variable for each group of provinces that constitute one of the five regions of the Regional Review Committees weighed by the numbers of inhabitants in the provinces.
Analyses
To calculate the frequencies of euthanasia, physicianassisted suicide, a combination of both, and non-assisted suicide we divided these numbers by the numbers of all deaths for each region and each year. To determine the averages and trends of these numbers we used a linear regression model with the percentages logarithmically transformed as outcomes, the five regions as a categorical independent variable, the calendar years 2002 through 2014 as a continuous independent variable, and the interaction between the regions and the calendar years as an independent variable. We did not separately determine the averages and trends of cases with a combination of euthanasia and physician-assisted suicide, because they constituted less than 0.1% of all cases in each region and each year. We likewise determined the averages and trends stratified per underlying disease relative to the numbers of all deaths due to the same disorder. To determine the averages and trends of the characteristics of the cases of euthanasia and physician-assisted suicide we used the same model, only with the logarithmically transformed percentages of the characteristics relative to the numbers of all cases of euthanasia and physician-assisted suicide as outcomes.
To determine whether the differences in the averages and trends of the numbers of euthanasia and physician-assisted suicide between the five regions could be explained by differences in demographic, socioeconomic, and health-related data between the regions, we separately added each aforementioned group of variables as covariates to the regression model and determined the adjusted averages and trends for each region. We imputed missing values of covariates using linear regression with respect to the calendar years, as linear trends were observed. When the analyses were repeated without these imputed values, similar results were obtained. We separately added each aforementioned variable on self-reported health as a covariate to the regression model, with the numbers of euthanasia and physician-assisted suicide, like these variables, averaged over the years from 2008 through 2011 to determine the adjusted averages for each region.
We did not calculate confidence intervals or statistically test the differences between regions, because the data were derived from the entire populations of all regions. The averages and trends had very narrow confidence intervals and differed between regions with p < 0.001.
RESULTS
Figure 1 shows the numbers of cases of euthanasia, physician-assisted suicide, and a combination of both reported from 2002 through 2014 in the five regions in the Netherlands relative to the numbers of all deaths in the same years and same regions. The total numbers of euthanasia and physician-assisted suicide increased in all regions.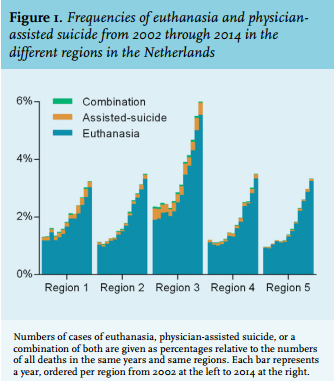
Table 1 quantifies the averages and trends of the numbers of euthanasia and physician-assisted suicide – with those of non-assisted suicide for comparison – from 2002 through 2014 in the five regions in the Netherlands relative to the numbers of all deaths in the same years and same regions. The averages and trends of the numbers of euthanasia and physician-assisted suicide differed up to 1.7% and 5.6%, respectively, whereas those of non-assisted suicide differed up to 0.2% and 1.0%. The average numbers of euthanasia and physician-assisted suicide were highest in Region 3.
Table 2 quantifies the averages and trends of the numbers of euthanasia and physician-assisted suicide per underlying disorder from 2002 through 2014 in the five regions in the Netherlands relative to the numbers of all deaths due to the same disorder in the same years and the same regions. As observed without stratifying per underlying disorder, the averages and trends differed between the regions, but the differences in the averages were smaller for disorders other than cancer and the differences in the trends were smaller for cancer. The averages were highest in Region 3 for all disorders.
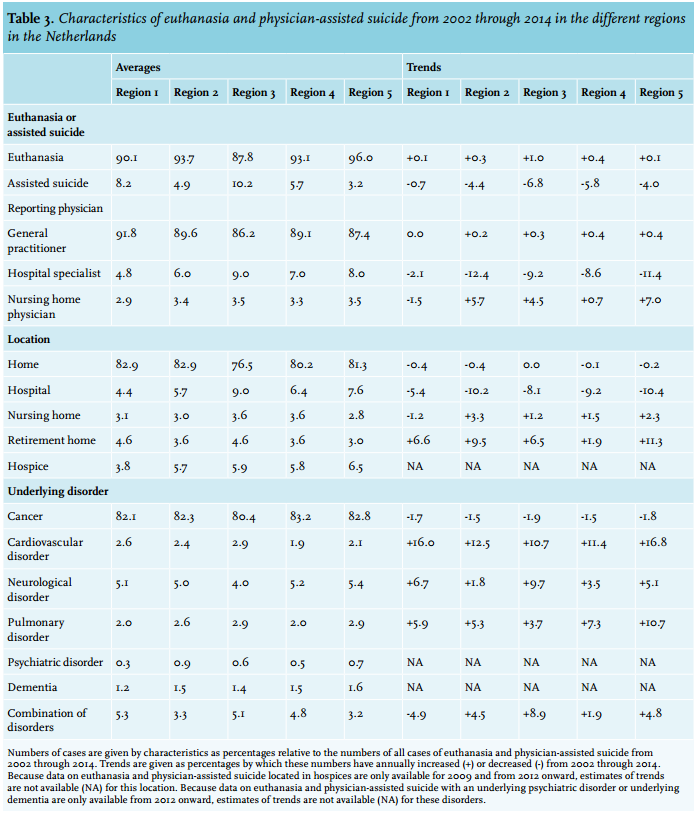
Table 3 shows the averages and trends of the characteristics of the cases of euthanasia and physician-assisted suicide from 2002 through 2014 in the five regions in the Netherlands relative to all cases of euthanasia and physician-assisted suicide in the same years and same regions. As observed for the averages and trends in the numbers of euthanasia and physician-assisted suicide, the averages and trends of their characteristics differed between the regions. Euthanasia accounted for the least cases, but increased the most, while physician-assisted suicide accounted for most cases, but decreased the most in Region 3. Euthanasia and physician-assisted suicide were reported the least by general practitioners, but the most by other physicians, were carried out the least in patients’ homes, but the most in hospitals, and were performed the least with cancer as the underlying disorder, but the most with a cardiovascular or pulmonary disorder in Region 3.
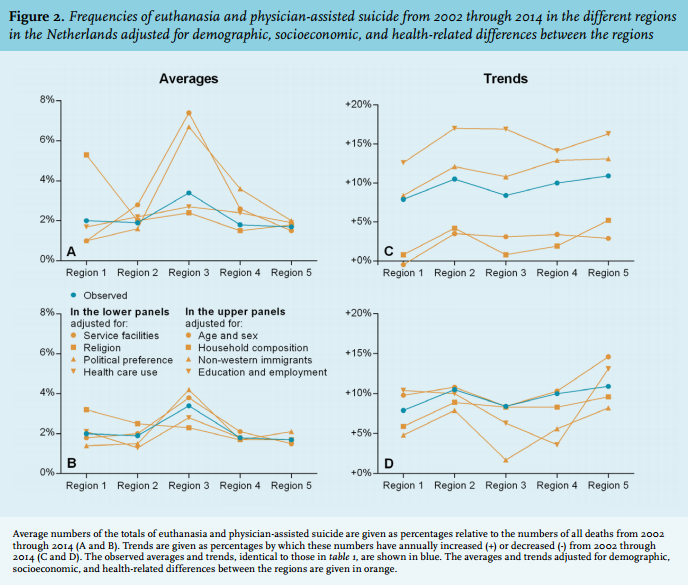
Figure 2 explores whether the differences in the averages (panels 2A and 2B) and the trends (panels 2C and 2D) of the numbers of euthanasia and physician-assisted suicide between the five regions could be explained by adjustments for demographic, socioeconomic, and health-related differences between these regions. The observed averages and trends (in blue) were compared with those estimated by eight models (in orange). The models adjusted for differences between the regions in, respectively, the distributions of ages and sexes, the household compositions, the numbers of non-Western immigrants, the levels of education and employment (panels 2A and 2C), the distances to service facilities, the distributions of religions, the distributions of political preferences, and health care use (panels 2B and 2D). Except for the model adjusting for differences in the levels of education and employment, which reduced the differences in the averages, none of the models could explain the differences in the numbers of euthanasia and physicianassisted suicide between the regions.
We explored whether the differences in the numbers of euthanasia and physician-assisted suicide between the five regions could be explained by differences in self-reported health between these regions. The numbers of euthanasia and physician-assisted suicide were not associated with any of the variables (data not shown).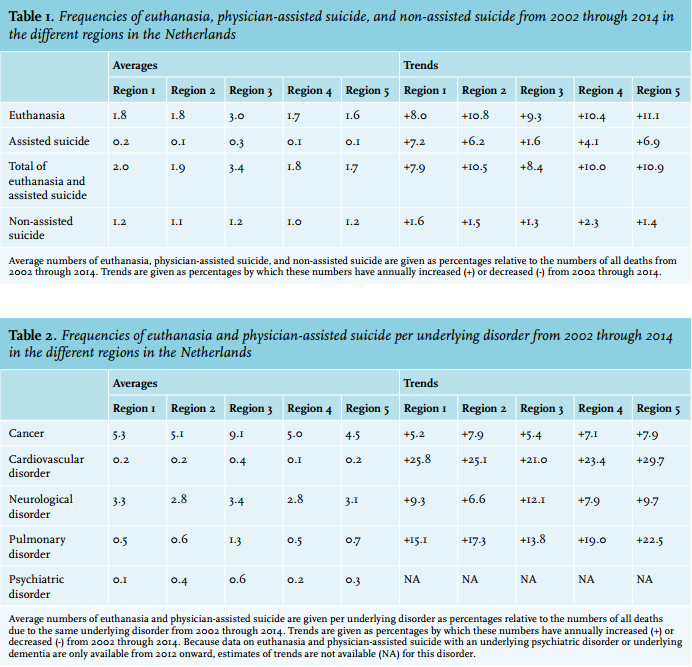
DISCUSSION
This study aimed to compare the frequencies, characteristics, and trends of euthanasia and physicianassisted suicide between five regions in the Netherlands since their legalisation. It demonstrated that they differed, whereas the averages and trends of non-assisted suicide were similar. It tried to explain these regional differences by demographic, socioeconomic, and health-related differences between the regions, but failed to do so.
In the comparison of the regions, Region 3 stood out. This region corresponds to the province of North Holland and includes the national capital Amsterdam. Here, the average number of cases of euthanasia and physicianassisted suicide was highest, also when stratified per underlying disorder. Moreover, when compared with the other regions, cases most often concerned euthanasia and least often physician-assisted suicide, were reported least often by general practitioners but most often by other physicians, were carried out least often at patients’ homes but most often in hospitals, and were least often with cancer but most often with a cardiovascular or pulmonary disorder as the underlying disorder. The trends in these frequencies and characteristics occasionally revealed the highest increase when the average was lowest in Region 3 and vice versa.
The regional differences in the averages and trends of euthanasia and physician-assisted suicide could not be explained by adjustment for demographic, socioeconomic, and health-related differences between the regions. Region 3 continued to stand out in all models, except for two models, which adjusted for household composition and religion, but which did not reduce the regional differences either. Only the model adjusting for levels of education and employment slightly reduced the regional differences in the averages. Furthermore, region-specific self-reported health was not associated with the numbers of euthanasia and physician-assisted suicide. Meanwhile, regional differences in the averages and trends of non-assisted suicide were almost absent.
Regional differences in the practice of euthanasia and physician-assisted suicide have never been studied within the Netherlands. Neither were regional differences reported in the recent elaborate evaluation of their legislation and practice, commissioned by the Dutch government.7 However, regional differences in their practice have been studied in Belgium, where they were legalised a year after the Dutch legislation under similar conditions.8 The large majority of cases reported to the Belgian Federal Review Committee originate from the Dutch-speaking regions. Physicians in these regions more often receive, grant, and report requests for euthanasia or physician-assisted suicide when compared with the French-speaking regions. The support of the legalisation is greater, the readiness to participate in its practice is more common, and the knowledge about the legal conditions is more accurate among physicians, while the support of the legalisation is slightly greater among the general population in these regions when compared with the French-speaking regions.9,10 Whether the characteristics and trends of euthanasia and physician-assisted suicide also differ between these regions has not been studied.
The practice of euthanasia and physician-assisted suicide has been compared between countries, mainly in Europe. Regardless of legalisation, frequencies of euthanasia and physician-assisted suicide vary between less than 1% to more than 3% of all deaths, while characteristics of the patients with whom such choices are made do not differ substantially.3,5 The support for euthanasia and physicianassisted suicide by the general population varies widely between countries. Support is mostly dependent on life stance and religion and, additionally, on a younger age, a higher socioeconomic status, and a higher level of education – but these variables do not fully explain the differences in support.11,12 The numbers of physicians supporting or opposing euthanasia and physician-assisted suicide vary widely too,3,4,13,14 with 36% to 84% never willing to participate.4 Those willing to participate are more often young, male, working in a hospital, experienced in palliative care, and influenced by a life stance or religion – but again these variables do not fully explain the differences in their willingness.4,13,14 Likewise within the Netherlands, considerable variation exists in the perceptions and arguments based on which physicians determine whether a patient meets the legal conditions for euthanasia or assisted suicide, including their assessment of the voluntariness of the request and the unbearableness of the suffering. This variation may be due to differences in their knowledge and interpretation of these legal conditions and of the practice of euthanasia and assisted suicide.15
The results of this study suggest that the variation in the practice of euthanasia and physician-assisted suicide between regions in the Netherlands have other than demographic, socioeconomic, or health-related explanations. The previous comparisons between other regions suggest that this variation may be a result of regional differences in the attitudes and knowledge of physicians and patients with regard to euthanasia and physician-assisted suicide, which leads to regional differences in support by the general population, demand by patients, and willingness of physicians. As a consequence, euthanasia and physician-assisted suicide may be more or less readily available for patients and more or less expected of physicians across the country. This result becomes problematic insofar a patient’s request for euthanasia or assisted suicide would be granted in some regions, but rejected in other regions, insofar a physician’s refusal of a request would be accepted in some regions, but assailed in other regions, or insofar a patient’s request and a physician’s cooperation would be encouraged by others in some regions, but not in other regions. In other words, this result becomes problematic insofar it would foster inequality, arbitrariness, and legal uncertainty.
As another possible explanation of the regional differences, the reporting rates of cases of euthanasia and physicianassisted suicide may differ between the regions. This is known to be true in Belgium,9,10 but has never been studied in the Netherlands. Here the national reporting rates have been constant and quite high since the legalisation, being 80% in 2005 and 77% in 2010. The most common reason not to report a case is the physician’s perception that it does not concern euthanasia or assisted suicide.16
As a limitation, this study uses data from the Regional Review Committees that are aggregated per region and per year to compare the frequencies, characteristics, and trends of euthanasia and physician-assisted suicide. To understand in more detail and with more certainty why their frequencies, characteristics, and trends differ between regions in the Netherlands, smaller regions in the country should be compared. The five regions in this study consist of predominantly progressive urban agglomerations as well as more traditional rural communities. The variation within each region may be even greater than between the regions. Ideally, individual data on the characteristics of those requesting or receiving euthanasia or physician-assisted suicide would be used to compare regions of the country. Future studies that use data from other sources to compare smaller regions than the five regions of the Regional Review Committees are required to allow for more refined conclusions.
Regional differences in health care practice have received much public attention in the Netherlands. The surgery rates for carpal tunnel syndrome, cataract, cholecystitis, cholelithiasis, hip arthritis, inguinal hernia, and spinal disc hernia are under scrutiny since they have been revealed to vary widely between regions.17 The same holds for cancer treatments18 and perinatal and maternal mortality rates.19,20 Demographic, socioeconomic, and health-related differences between the regions cannot fully explain these differences in health care practice. Rather, they are a consequence of regional differences in the organisation and availability of health care. Health care professionals, insurers, and policymakers regard the regional differences as infringements on the quality of care and strive to minimise them.
If we deem it important to understand the regional differences in health care practice and to minimise these differences insofar they cannot be justified by demographic, socioeconomic, or health-related differences between the regions, then should we not likewise treat the regional differences in the practice of euthanasia and physician-assisted suicide? After the first exploration in this study, further research may specify in more detail how and why the practice of euthanasia and physician-assisted suicide differs between regions in the Netherlands and to what extent the regional differences reflect a deficiency in the quality of end-of-life care.
ACKNOWLEDGEMENTS
The authors are grateful for the advice of Professor T. Stijnen (Department of Medical Statistics and Bioinformatics, Leiden University Medical Center) and M.E. Verhoeff (Department of Epidemiology, Erasmus Medical Center) on the methodology.
DISCLOSURES
The authors have no funding or conflicts of interests to disclose.
REFERENCES