KEYWORDS
Cardiovascular events, glucose-lowering drugs, mortality, risk factor control, type 2 diabetes
INTRODUCTION
The quality of T2DM care in the Netherlands ranked second in the Euro Diabetes Index 2014,1 due to its highly organised primary care programs that involve regular check-ups in a multidisciplinary team of general practitioners (GPs), assistants, dieticians, podologists, and ophthalmologists. GPs are the primary treating physicians of T2DM patients in the Netherlands. Quality indicators used by healthcare insurance companies to incentivise GPs to optimise diabetes care focus on procedural aspects of care, such as the intervals between check-ups and adherence to guidelines with respect to risk factor control and treatment. The Euro Diabetes Index 20141 stated that the main criticism of Dutch diabetes care is the lack of data on short- and long-term cardiovascular outcomes.
T2DM is associated with increased risk of microvascular complications, cardiovascular morbidity, and mortality,2,3 which is generally more pronounced among women.4 The aim of T2DM treatment guidelines is stated as the prevention and treatment of micro- and macrovascular complications.5-7 Lifestyle advice includes a healthy diet, smoking cessation, increased exercise, and weight loss. Treatment targets are set for the three pharmacologically treatable risk factors low-density lipoprotein cholesterol (LDL-C), blood pressure (BP), and glycated haemoglobin (HbA1c). The relationship between LDL-C and BP and major cardiovascular events is well established.8,9 For HbA1c, there is a well-established relationship with microvascular complications10,11 and to a lesser extent with macrovascular complications.12,13 The Action to Control Cardiovascular Risk in Diabetes (ACCORD) trial showed that intensive glucose-lowering treatment to reach HbA1c < 42 mmol/mol (< 6%) decreased the risk of microvascular events and myocardial infarctions, but increased the risk of mortality and severe hypoglycaemic events.13,14 Re-evaluation of the benefits and risks of treatment in specific age groups led to the introduction of individualised targets in the 2013 revision of the Dutch treatment guideline for T2DM.5
No new BP and cholesterol-lowering drugs were introduced in the study period, except for pro-protein convertase subtillsin/kexin type 9 (PCSK-9) inhibitors for very high-risk patients in 2015.15 Glucose-lowering treatment options changed considerably, with new additions in the classes of dipeptidyl peptidase 4 (DPP-4) inhibitors, glucagon-like peptide 1 receptor agonists (GLP1-RA) and sodium-glucose co-transporter 2 (SGLT-2) inhibitors,16 and withdrawal of rosiglitazone. Nevertheless, the stepwise treatment algorithm to obtain glycaemic control (start with metformin and if necessary, add sulfonylureas (SU) and ultimately basal insulin) was only revised with regard to the mention of gliclazide as preferred SU in 2013.5 This was due to its low risk of cardiovascular mortality and hypoglycaemia in comparison to other SUs, and the fact that no dose adjustment is deemed necessary for renal impairment.17
In Sweden, a country with good quality and accessibility of health care, incidence rates of cardiovascular disease remained high despite changing diabetes care. However, improvements in the number of life years lost to diabetes were observed in a T2DM population relative to a diabetes-free population from 2006 to 2013, with the excess mortality among women slowly declining over time.18 So far, it is unclear what changes have occurred in diabetes care and outcomes in the Netherlands. We therefore investigated trends in excess cardiovascular incidence and mortality in the T2DM population relative to the diabetes-free population between 2008 and 2016, goal attainment of pharmacologically-treated risk factors, and changing glucose-lowering treatment, in view of changing guidelines.
MATERIALS AND METHODS
Setting and patient selection
Health care data were obtained from the PHARMO Database Network, which links out-patient pharmacy drug dispensings, laboratory test results from both primary and secondary care, primary care GP records, secondary care hospitalisations, and mortality records. In order to be able to accurately capture cardiovascular event dates, we used hospitalisation data from the Dutch Hospital Data Foundation.19 The source population for this study was limited to the overlapping geographical areas in which these data were collected. Mandatory health insurance and required registration with a GP makes the GP Database representative of the general Dutch population. The out-patient Pharmacy Database is representative of the general population that has picked up prescription drugs or has registered with a pharmacy. Therefore, the diabetes population represented in the PHARMO Database Network has been shown to be representative of the pharmacologically-treated Dutch diabetes population.20
Within this source population, we identified annual cohorts of patients with T2DM with index dates of January 1st of each year in the period 2008-2016. Patients with less than a year of recorded history prior to index date (i.e., start of data collection < 365 days before index date) were excluded from the annual cohort. Patients were identified based on at least two glucose-lowering drug (GLD) dispensings within the year prior to index date. Inclusion was restricted to patients aged 18 or older at index date, without type 1 diabetes, gestational diabetes, or polycystic ovary syndrome. Matched cohorts of patients without diabetes were created separately for each annual cohort based on age (i.e., matched 1:1 with birth year), sex, and treating GP, to control for possible differences in recording of morbidity and data collection periods between GPs.
Patient characteristics
Prevalent cardiovascular morbidity and cancer at index date were extracted from GP and hospitalisation records in all available history. Antihypertensive medication use, statin use, and platelet aggregation inhibitor use were determined in the year prior to index date. In the year prior to index date, the last recorded body mass index (BMI) and BP were extracted from GP records; HbA1c and LDL-C from GP records were supplemented with available clinical laboratory results.
Cardiovascular events and mortality
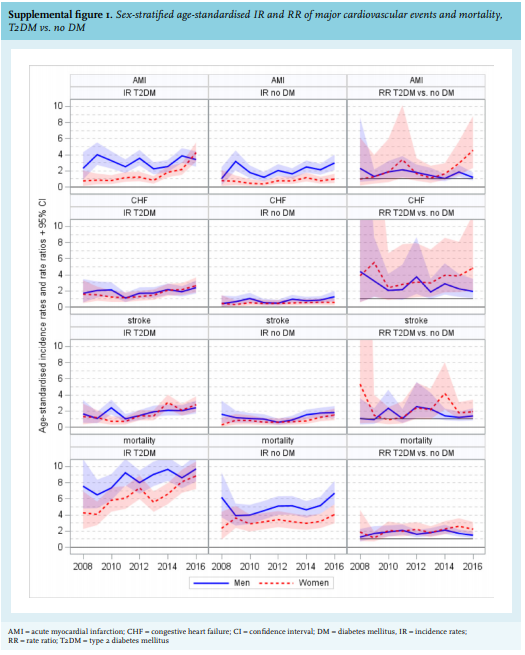
Annual age-standardised mortality rates and incidence rates of hospitalisations for acute myocardial infarction (AMI), congestive heart failure (CHF), and stroke were determined in the year after index date. Patients with T2DM were compared to matched controls without diabetes using rate ratios (RR).
The number of life years lost to T2DM, cardiovascular disease (CVD; including AMI, angina pectoris, CHF, stroke, and peripheral artery disease) or both T2DM and CVD were determined by subtracting life expectancy in patients with the condition to those without it.
Unmatched patients with T2DM were excluded from analyses of cardiovascular events and mortality.
Risk factor control
HbA1c goal attainment was assessed per age group according to the guidelines in use. From 2008-2012 the HbA1c target was 53 mmol/mol (7.0%) for all age groups. After the revision of the Dutch GP guidelines in 2013, the HbA1c target of 53 mmol/mol (7.0%) remained unchanged for patients aged < 70 and for elderly patients who were managed with lifestyle advice or treated with metformin only. For patients over 70 years treated with other GLD, the target was set to 58 mmol/mol (7.5%) if they were diagnosed up to 10 years ago, or 64 mmol/mol (8.0%) if they were diagnosed more than 10 years ago. For LDL-C and systolic blood pressure (SBP), the corresponding targets were set at ≤ 2.5 mmol/l and ≤ 140 mmHg, respectively. For patients over 80 the SBP target was raised to 160 mmHg in 2013.
GLD use
The type of GLD treatment was determined using drug classes based on level 3 Anatomical Therapeutic Chemical coding for non-insulin GLD, and insulin was considered as one class. In addition, gliclazide was analysed separately from other SUs. The proportion of patients in each annual cohort using specific GLD classes at some time during the year was determined. Furthermore, per annual cohort, we recorded which new class of GLD was initiated as second-line GLD after at least six months of first-line metformin monotherapy, either as add-on or switch. First-line therapy was defined as the first GLD dispensing after at least six months of recorded medication history without GLD. Simultaneous initiation of more than one GLD class was classified as ‘other’ GLD in this analysis.
Statistical analyses
Confidence intervals around annual incidence rates (excluding patients with a history of the event investigated) were based on Byar’s approximation of the Poisson distribution. Trends over time were tested using Poisson regression at P-value < 0.05. Age standardisation of incidence rates was performed by direct standardisation where the Dutch population on January 1st of the calendar year (according to data from the Dutch Central Bureau for Statistics) was used as the standard population.21
Sullivan’s life table analysis was applied for calculating life expectancy at the specific reference age using 2-year age strata. The Sullivan method combines information on morbidity and mortality to estimate years lived with and without a specific disease, i.e., T2DM, CVD, or both.22 Sex differences were explored for all outcomes. All analyses were performed using SAS version 9.4 (SAS Institute Inc., Cary, NC, USA).
RESULTS
Patient selection, characteristics
In total, 53,602 T2DM patients were included in annual cohorts (figure 1). Fewer than 4% could not be matched to diabetes-free patients because age- and sex-matched controls were not available in some general practices. The proportion of men increased from 51% to 55% between 2008 and 2016 and the overall mean age from 66 to 69 years (table 1), with women being slightly older (68 to 71 years) than men (64 to 68 years). The proportion with cardiovascular morbidity increased from 23% to 37% and cancer from 5% to 15%. Antihypertensive drug use increased from 69% to 74% and statin use from 60% to 68%; platelet aggregation inhibitor use was stable over time at 31% (not included in table 1).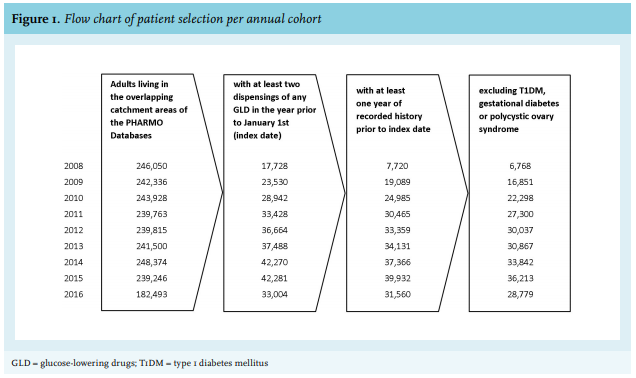
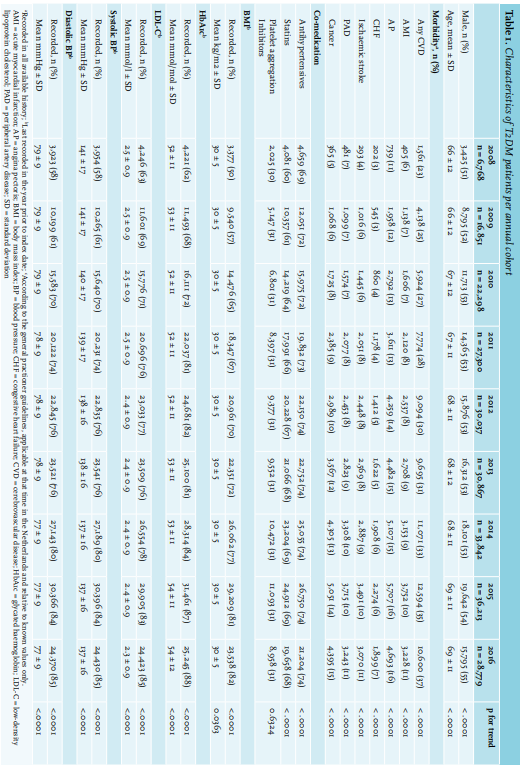
The proportion of patients with recorded assessments of LDL-C, BP, HbA1c, and BMI increased over time (table 1). Mean levels of LDL-C, BP, and HbA1c decreased slightly over the study period. Mean BMI was 30 kg/m2 (SD 5 kg/ m2 ) over the entire study period and comparable between sexes. Characteristics of matched cohorts of patients without diabetes are presented in Supplemental table 1.
Cardiovascular events and mortality
Age-standardised incidence rates of hospitalisations for cardiovascular (CV) events (AMI, CHF, and stroke), and mortality rates were higher among T2DM patients compared to diabetes-free patients (figure 2). On average, T2DM increased the risk of mortality by 86% without a clear trend over the study period. Slowly increasing trends were observed for age-standardised incidence rates for CV events (p for trendT2DM = 0.0153 for AMI; < .0001 for CHF and stroke) and mortality (p for trendT2DM < .0001), but RRs did not show clear trends, indicating the increase was proportional in diabetes patients and non-diabetes patients. On average, T2DM increased the risk of AMI by 69%, CHF by 185%, and stroke by 57%. Incidence rates for AMI and mortality were considerably higher for males compared to females, but RRs were similar between sexes (Supplemental figure 1). 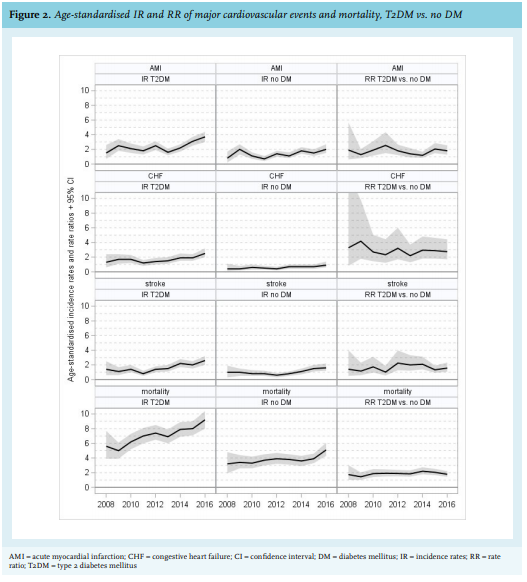
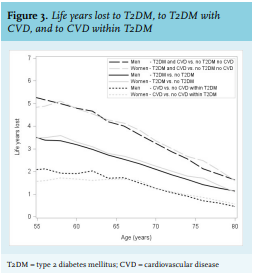
Life years lost to T2DM decreased from 3.5 years at age 55 to just over 1 year at age 80 (figure 3). No clear differences were observed between the sexes. Below the age of 55 the power was insufficient for both sexes to reliably calculate the life years lost to T2DM. The number of life years lost to the combination of T2DM with CVD ranged from about 5 years at age 55, and just below 2 years at age 80. CVD combined with T2DM thus caused an additional loss of 1.5 years at age 55 and 0.7 years at age 80 compared to T2DM alone. Comparing patients with and without CVD within a T2DM population resulted in about 1.8 life years lost to CVD at age 55 (higher for men) and 0.7 years at age 80 in both sexes.
Risk factor control
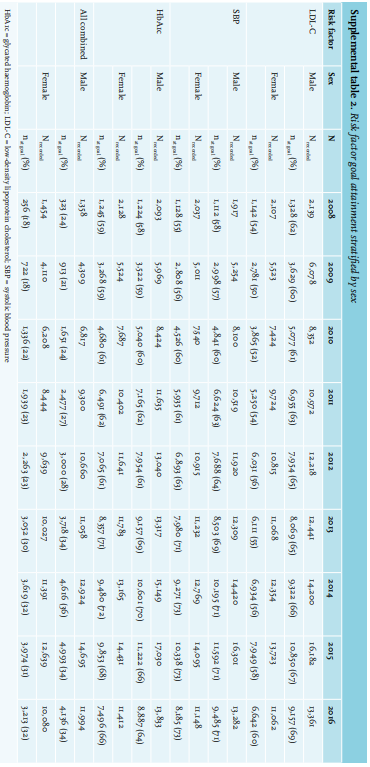
Figure 4 shows proportions of patients at goal for LDL-C, SBP, HbA1c, and all risk factors combined over time, stratified by age group. Overall LDL-C goal attainment rose from 56% in 2009 to 65% in 2016 (p for trend < .0001) (male 60% to 69%, female 50% to 60%, data not shown). Overall SBP goal attainment rose from 57% to 72% (p for trend < .0001), HbA1c goal attainment from 58% to 65% (p for trend < .0001), both similar between the sexes (data not shown). LDL-C and HbA1c goal attainment were considerably lower among the younger age groups, whereas SBP goal attainment was considerably higher. In 2009, 21% of patients attained all goals, which rose to 33% in 2016 (p for trend < .0001). The lowered HbA1c targets for patients over age 70 treated with metformin only caused HbA1c targets to rise sharply in 2013, but this had a very limited effect on combined goal attainment for the age group of 70-80 years. Raised SBP and HbA1c targets for patients over the age of 80 in 2013 caused combined goal attainment to double from 22% to 44% in this group. Combined goal attainment was about 3-4% points lower in women than in men over the entire study period (Supplemental table 2).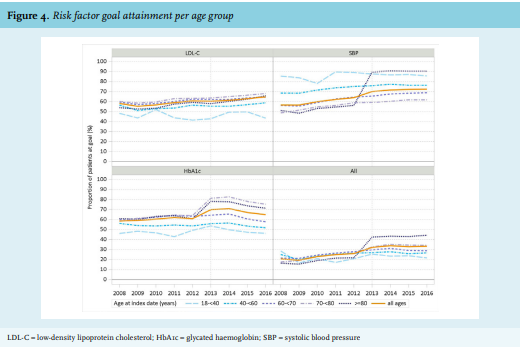
GLD use
More than 80% of patients used metformin, which increased slowly over the study period (figure 5). The proportion using SUs decreased from 50% in 2008 to 43% in 2016. Between 2012 and 2016, a sharp increase in gliclazide use from about 11% to approximately 25% was observed. The proportion of insulin users was approximately 25%, showing a minimal increase over the whole study period. The proportion of patients using thiazolidinediones dropped from about 7% in 2008 to about 1% in 2012; for DPP-4 inhibitors, the proportions increased from 1% in 2008 to 7% in 2013, after which the proportion stabilised. Other GLD were used by only up to 0.5% of patients.
In total, second-line treatment after ≥ 6 months mono-metformin use was recorded for 4,159 patients during the study period (2008-2016). The proportion starting second-line therapy with SUs dropped from 96% in 2008 to 80% in 2012, then increased to 93% again in 2016 (figure 6). Within the SU class, the use of gliclazide decreased from 23% to 19% until 2012; afterwards, it increased sharply to 88% of all second-line therapy. The second most-used GLD drug class in second-line therapy was DPP-4 inhibitors, which increased until 2012 and then decreased again.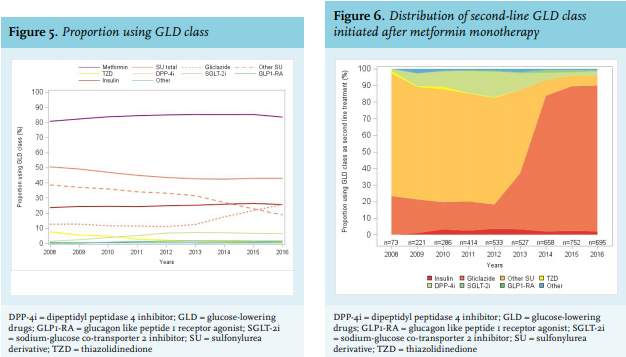
DISCUSSION
In the Netherlands, loss of life due to T2DM is considerable, averaging 3.5 years at the age of 55 compared to the general population and independent of sex. Diabetes and CVD combined, account for 5 years lost at age 55. Within the diabetes population, CVD accounts for 1.5 to 2 years lost at age 55. CVD is therefore an important driving factor behind diabetes mortality, which is why diabetes treatment guidelines aim to prevent excess mortality through prevention of CVD. Nevertheless, in our cohort of diabetes patients requiring glucose-lowering treatment, incidence rates for hospitalisations for AMI, stroke, and CHF, as well as mortality rates, increased slightly over the study period. Interestingly, this also occurred to a similar extent, in the matched diabetes-free patients, and no obvious trends could be observed in the RRs, suggesting that changes in guidelines did not yet result in reduced CVD or mortality.
Excess risk of AMI and stroke in our study were within the same range as reported by a Swedish study (69% vs. 70% for AMI; 50% vs. 57% for stroke) but excess risk of CHF was higher in our study (185% vs. 80%)18. This may be explained by the fact that we based incidence rates of cardiovascular events on hospitalisations only, in order to capture accurate event dates. However, with respect to CHF, there may be some detection bias: patients with T2DM may be referred to a hospital sooner than patients without CHF because GPs may be more vigilant in this population and may suspect CHF sooner. A Spanish study found that despite a 5-fold increase in hospitalisations for CHF in diabetes patients compared to non-diabetes patients, the mortality rate was actually lower,23 which would aligns with the idea that diabetes patients are referred sooner.
In T2DM patients, incident AMI and mortality are generally reported to be higher for men, similar to our results, but excess risk of cardiovascular morbidity and mortality due to T2DM is usually higher in women compared to men, in contrast to our findings.2,3,24 A trend of diminishing sex differences among high-income countries has been reported with respect to mortality, cardiovascular outcomes, and treatment.18,25 Differences in treatment, higher life expectancy of diabetes-free women, as well as a greater decline in risk factors associated with diabetes in women compared to men are all thought to contribute to the sex difference in excess mortality.2,3,24 LDL-C, SBP, and HbA1c have been shown to be important risk factors for excess mortality in diabetes: non-smokers without albuminuria and LDL-C, SBP, and HbA1c within target ranges were reported to have limited to no excess risk of mortality, AMI, or stroke, although substantial excess risk of heart failure due to T2DM remained.2,3,26 Access to health care in Scandinavian countries is similar to the Netherlands. It is therefore interesting to note that the number of life years lost by Swedish men is similar to Dutch men and women, but Swedish women had a slightly higher excess mortality, despite declining sex differences since 2006.18
In our study, we found that despite modest improvements over time, goal attainment for LDL-C and HbA1c was especially poor in younger patients. Only approximately 25% of patients under the age of 60 have LDL-C, SBP, and HbA1c within target range. This is important, since the Swedish study also suggested there may be greater potential gain for young patients.26 Results of combined risk factor control and life years lost in our study suggest much can be gained by more aggressive treat-to-target in young patients.26
According to our analyses, loss of life years attributable to diabetes is less than 1 year at age 80. Physicians will therefore be less inclined to treat-to-target, which is aligned with the Dutch GP guidelines stating that in elderly patients, prevention of symptomatic hyper- and hypoglycaemic events is the main focus, rather than goal attainment.5 The raise of HbA1c and SBP targets in the 2013 revision of the guidelines are based on the same principle.5 It also states that it is up to the GP to convince younger patients to adhere to targets, even if patients prefer not to because of the impact on life style.5
Use of GLD was aligned with the position of the Dutch GP guidelines: metformin, SU, and insulin were the most frequently-used medications; new drug types such as DPP-4 inhibitors, GLP1-RA, and SGLT-2 inhibitors were used by fewer than 10% of patients during the entire study period. According to the 2006 guideline, first-line oral GLD should be metformin, and second-line treatment, the addition of SU.6 The increase in use of DPP-4 inhibitors as second-line treatment over the period 2008-2012 was probably a result of reported lower rates of hypoglycaemic events compared to SU.27 In 2010, the Dutch GP association discouraged the use of DPP-4 inhibitors and GLP1-RA because of lack of evidence of long-term safety and efficacy.28 In the 2013, revision of this position was confirmed, and gliclazide was introduced as preferred SU.5 After 2013, gliclazide use increased substantially, whereas other SU use decreased substantially, and DPP-4 inhibitor use declined slowly. This pattern is especially evident in the initiation of second-line treatment after a minimum of six months metformin monotherapy as first-line treatment. In Sweden, the use of insulin increased by 30% in the period 2006-2013 to 28%, whereas the use of SU decreased by 55%.18 Relative changes in overall SU use (-14%) and insulin use (+10%) in the Netherlands were very modest.
Even though the Dutch guidelines indicate treatment intensification usually increases treatment satisfaction, the importance of reaching a consensus with the patient is also highlighted.5 Treatment inertia may be driven in part by reluctance of patients to initiate insulin therapy if targets are not reached with metformin or SU.29 Basal insulin has long been the only third-line treatment option in the conservative Dutch guidelines, with high adherence.5,6 In that respect, it is interesting to note that in the 2018 partial revision of the Dutch GP guidelines, third-line treatment options now include GLP1-RA and DPP-4 inhibitors as alternatives to basal insulin. If glycaemic control is not reached with those options, acarbose, SGLT-2 inhibitors, pioglitazone, or repaglinide may be considered.30 International guidelines have adopted the use of the new treatment classes as early as second-line treatment31 and as a result, in many other European countries, their use was incorporated into diabetes type 2 care much earlier and to a greater extent over the past decade.1,18,32
Strengths and limitations
The data used for this study come from regular care and were not recorded for research purposes. Completeness of data and detail of information could therefore not be controlled. By matching patients on age, sex, and GP practice, it was ensured that differences in event rates between cohorts with and without T2DM were not driven by differences in recording of events by different GPs.
The study was performed in a database representative of the Dutch population and standard T2DM care in the Netherlands, combining diabetes treatment prescribed in both primary and secondary care. We limited analyses to pharmacologically-treated patients, which excludes approximately 20% of all diabetes patients. This may have led to overestimation of the cardiovascular risk for the entire T2DM population. The slightly higher HbA1c goal attainment reported in this study in comparison to a previous Dutch study covering a different part of the Netherlands, may have been caused by the inclusion of patients not using GLD, who are less severely diseased.33 Due to transfer of data governance during the study period, coverage of hospitals in the Hospitalisation Database dropped to 85% in 2016. However, this sample of participating hospitals from which data are collected is representative of all Dutch hospitals with regard to type of hospital. Generalisability of our study to the Dutch population was therefore considered good.
The majority of HbA1c and LDL measurements were retrieved from GPs. Clinical laboratory data were used to complete those measurements for patients in secondary care (5-10% of patients), but these records were not available for all patients. This may have led to an underrepresentation of patients with poor glycaemic control and high cardiovascular risk for this subset. Furthermore, assessments of HbA1c, LDL, BMI, and BP in GP records were more frequently recorded over time, probably due to health insurance companies reimbursing GPs for the quality of record keeping when the GP is the primary treating physician in the management of T2DM, per incentives that were introduced in 2010. In general, we assume that GPs may have been more likely to record patients off target than those on target before 2010. If recording proportions increase due to the 2010 introduced incentives, this may account for more patients who are registered at target. Therefore, we may have underestimated goal attainment at the start of the study period. The risk factors albuminuria and smoking were not included in our study. The increased prevalence of comorbidities over the study period is observed in both T2DM and control cohorts; therefore, this may be attributed to increasing age and disease duration, rather than improved recording practices.
Although mortality rates in the general Dutch population are reported to decrease over time,34 we observed a slight increase in our control cohort. The fact that we analysed an ageing subgroup of the general population might explain this difference, because younger age groups were underrepresented and therefore grouped together for standardisation. As the aim was to compare our cohorts, age standardisation can serve to compare rates with other diabetes studies, but not with general populations. Adherence to guidelines has remained strong over the past decade, which is reflected in the conservative choices of treatment, indicating alignment with changing guidelines. During the study period, around two-thirds of patients attained goals for HbA1c, BP, and LDL-C. Despite these signs of good quality in diabetes care, only one in three reached combined goal attainment in 2016. Event rates of cardiovascular events and mortality increased over time, although the increase in T2DM patients was proportional to that in the diabetes-free population and no clear trend could be observed for RR. T2DM shortens a 55-year-old patient´s life expectancy by 3.5 years, irrespective of sex. The presence of cardiovascular complications reduces the number of life years by an additional two years at the age of 55. Trends in excess cardiovascular events and mortality due to T2DM were similar to those found in Sweden, although sex differences were absent. Poor risk factor control below the age of 60 suggests that major gains may be expected from further improving cardiovascular risk factor control in diabetes patients.
DISCLOSURES
Acknowledgements
The authors would like to thank all the healthcare providers contributing information to the PHARMO Database Network.
Conflicts of interest
Edith M. Heintjes, Eline Houben, Fernie J.A. Penning-van Beest, and Ron M.C. Herings are employees of the PHARMO Institute for Drug Outcomes Research. This independent research institute performs financially supported studies for government and related healthcare authorities and several pharmaceutical companies.
Wendy L. Beekman-Hendriks, Esmé Lighaam, and Susanne Cremers are employees of AstraZeneca BV, the Netherlands, working as Medical Evidence Delivery Manager and Medical Advisors Cardiovascular, Renal & Metabolism, respectively.
Coen Stehouwer is Professor of Internal Medicine at Maastricht University Medical Centre and declares no duality of interest.
Grant support
This study was sponsored by AstraZeneca BV. Previous publications: Some of the study results were presented as a poster at the European Associate for the Study of Diabetes meeting held October 1st – 4th, 2018 in Berlin, Germany; and as an oral presentation at The Professional Society for Health Economics and Outcomes Research Europe 2018 Conference held November 10-14th, 2018 in Barcelona, Spain; as well as the Annual Dutch Diabetes Research Meeting 2018 held November 28-29th, 2018 in Oosterbeek, the Netherlands.
REFERENCES