KEYWORDS
Absorption, serum levels, therapeutic drug monitoring, tuberculosis
BACKGROUND
Tuberculosis (TB) remains one of the world’s most important infectious threats, reflected by 1.8 million deaths in 2015, of which 0.4 million deaths among people living with HIV.1 Hence, adequate treatment is paramount. Rifampin is a key drug in the first-line treatment of active or latent TB, due to its high activity against Mycobacterium tuberculosis with an MIC90 of ≤ 0.25 µg/ml.2-4
The treatment success rate, especially in new cases, is improving although treatment failure occurs in up to 14% of patients.5 While multiple factors, including poor treatment adherence, bacterial resistance and even drug quality, may contribute to treatment failure, drug dosage and insufficient concentrations are relevant in this regard. In a previous study, the risk of failure of long-term treatment was almost 9-fold higher in patients with low drug exposure, expressed as 24-hour area under the concentration time curve (AUC0-24) for pyrazinamide, rifampin and/or isoniazid.6
That study and other data showed that insufficient serum concentrations may even result in development of drug resistance.6,7 Apart from the prescribed dose, drug exposure may be influenced by factors such as comorbidities, food intake and inter-individual differences in pharmacokinetics.7-12
Therapeutic drug monitoring (TDM) of rifampin is not routinely performed and there is no consensus on adequate levels. In previous studies, rifampin serum concentrations at 2 hours (C2 ) and at 6 hours (C6) after intake have been used to approximate the peak level.13-15 A recent study found that the rifampin AUC0-24 in TB patients was predicted optimally using sampling at time points 1, 3, and 8 hours,16 which would be impractical for most outpatients or require availability of alternative methods such as dry blood spot analysis. During the past decades, a rifampin absorption test at our centre has consisted of measurement of serum concentrations at 0, 3 and 6 hours after intake, and only at the physician’s request. The aim of the present study was to retrospectively evaluate the results of these absorption tests of rifampin regarding adequate levels, and factors associated with out of range serum concentrations.
STUDY POPULATION AND METHODS
Study population
The study population consisted of patients in whom one or more rifampin serum concentrations had been measured at Leiden University Medical Centre (LUMC), a tertiary care hospital, between October 2005 and May 2014. Demographic and clinical characteristics were collected from the medical charts, including age, sex, weight, country of origin, clinical diagnosis, comorbidity (HIV infection, present or past malignancy, liver disease, diabetes mellitus, chronic kidney failure, autoimmune disease(s) or other), pregnancy, concomitant medication, rifampin dose at the time of TDM, kidney and liver function, indication for TDM and side effects. Serum concentrations of rifampin at 0, 3 and 6 hours after intake, time of blood sampling, possible dose change and results of possible repeated TDM were collected. Patients were excluded if only a trough level was available or if the clinical data could not be retrieved.
The protocol of this retrospective study with anonymised data collection was evaluated by the Medical Ethics Committee of the LUMC and waived from the requirement of informed consent (protocol G16.017).
Criteria for interpretation of serum concentrations
As there are no uniform criteria for adequate rifampin levels, we used two different criteria. According to the original protocol used at our institution for several decades, the source of which could not be retrieved, serum levels of the sum of rifampin and desacetyl-rifampin ≥ 3 mg/l at 3 hours (C3 ) and 6 hours (C6) after intake were defined as adequate (criterion 1: C3 and C6 ≥ 3) and clinical decisions therefore were only based on this criterion. As an alternative criterion, adequate absorption was defined as a single measurement of the sum of rifampin and desacetyl-rifampin ≥ 5 mg/l (criterion 2: C3 or C6 ≥ 5) as is nowadays implemented in several institutions. The data were analysed according to both criteria.
Method of measurement of rifampin concentrations
Serum concentrations of rifampin and desacetylrifampin were measured by high performance liquid chromatography according to the method published by Chandi et al.17 The method was linear in a concentration range of 0.5 mg/l up to at least 15 mg/l rifampin and/or desacetyl-rifampin. Accuracy was > 98.8% and imprecision < 5.7%.
Statistics
Descriptive statistical parameters were used. To compare proportions or continuous values between two groups, two-way chi square tests (or Fisher’s exact probability test in case of comparison of proportions including numbers < 5), and ANOVA tests were used, respectively. Differences using two-sided testing were considered significant at p < 0.05. Statistical analysis was performed using IBM SPSS Statistics version 23.
RESULTS
Study population
Of 90 patients in whom rifampin levels had been determined, 63 met the inclusion criteria (15 were excluded because only a trough level had been measured and 12 because clinical data were unavailable). Patient characteristics are shown in table 1. The majority (42/63, 67%) were immigrants from TB endemic regions. Most patients had one or more comorbidity, with autoimmune disease, chronic liver disease and malignancy being most frequent.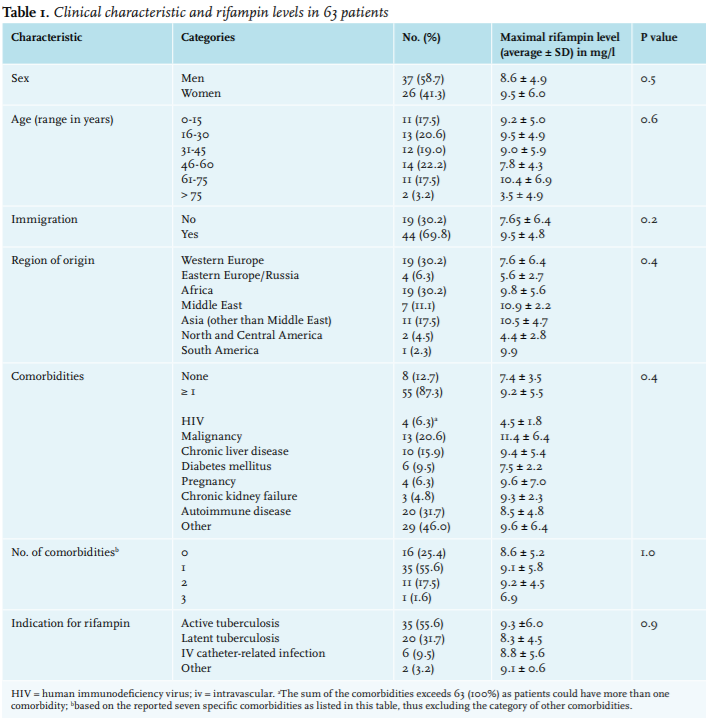
Serum rifampin concentrations
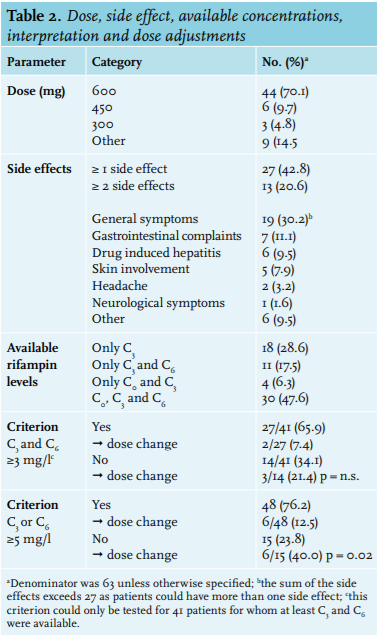
In 63 patients, a total of 138 rifampin concentrations (at 0, 3 and/or 6 hours) were available. Rifampin levels were not always available for all three time points (table 2). C3 was available for all 63 patients, C0 was available for 34/63 patients (54%) and C6 for 41/63 patients (61%). According to the guidelines for TB treatment the standard dose of rifampin is 10 mg/kg, with a maximum of 600 mg. Most patients (45/63, 71.4%) were treated with a dose of 600 mg (table 2). The dose was 600 mg in 42/46 (91.3%) patients with a body weight ≥ 55 kg. The mean ± SD dose per weight was 11.2 ± 3.9 mg/kg. Maximal rifampin levels did not differ according to dose per weight (data not shown). Maximal levels did not vary by any demographic or clinical parameter (table 1).
Trough levels were < 2 mg/l in 31/34 patients (91.2%) and were 3.2 mg/l, 5.6 mg/l and 9.9 mg/l respectively in the remaining three patients. In the last of these three patients (patient 41 in figure 1), C0 exceeded C3 and C6 and thus had most likely been measured after intake of rifampin. The average individual maximal concentration, which could be either at 3 or at 6 hours, was 8.9 mg/l (range 0.0 mg/l to 26.7 mg/l). With regard to criterion 1: C3 and C6 ≥ 3, 41 patients could be evaluated. Criterion 1 was met in 27/41 (65.9%). Criterion 2: C3 or C6 ≥ 5 was met in 48/63 patients (76.2%). There was no significant relation between age, sex, comorbidities, co-medication or indication for rifampin comorbidities and meeting the criteria or not. Levels in immigrant patients more frequently met criterion 2 than did those from native Dutch patients (86.4% vs 52.6%, p = 0.004).
Figure 1 shows all individual rifampin concentrations, ranked by the value of C3 which was available for all 63 patients. C3 exceeded C6 in all but 8 patients (case 2, 9, 12, 17, 18, 24, 46 and 53 in figure 1). C6 was ≥ 5 mg/l and often even much higher in all of these eight patients with late maximal concentrations. In 7/8 patients criterion 1: C3 and C6 ≥ 3 was also met. Of the eight patients with late maximal levels, four (50%) had diabetes mellitus and one additional patient suffered from systemic sclerosis. In the remaining three patients no factors associated with delayed absorption could be identified. The proportion of patients with diabetes in those with late maximal levels (4/8 patients with C6 > C3 ) was significantly different from that in patients with early maximal levels (1/33 patients with C3 > C6; Fisher’s exact probability test p = 0.003).
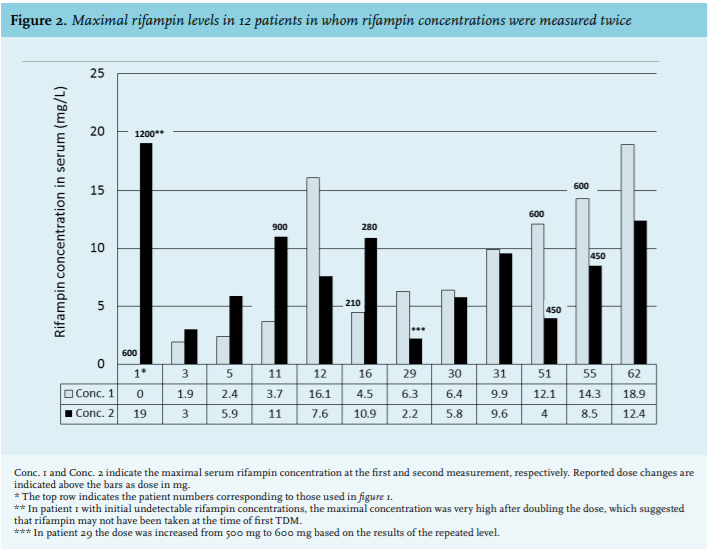
In 12 patients (19%) rifampin measurements including at least C3 were later repeated after a median interval of 11 days (range 1-50 days, and one outlier at 248 days) because of out of range first levels, newly experienced side effects and/or after adjustment of the dose based on initial levels. The results of paired individual maximal serum concentrations are shown in figure 2. 
Side effects
At least one side effect was reported in 27/63 patients (42.8%). Side effects varied from mild to very severe, ranging from minor nausea to drug-induced hepatitis (table 2). The maximal rifampin level in patients experiencing side effects was not significantly different from that in patients without side effects. In the six patients with serum transaminases > 100 IU/l, the maximal level was not different from that in patients without liver function disturbances.
Dose adjustments
Twelve out of 63 patients (19.0%) had a dose adjustment. Six of 15 patients (40%) who did not meet criterion 2 had a dose increase. Six of 48 patients (12.5%) meeting criterion 2 had a dose reduction. This difference in proportion with a dose adjustment was significant (p = 0.02).
A dose adjustment was made in 5/13 patients who experienced ≥ 2 side effects, in 3/14 patients with one side effect and in 4/36 patients without side effects (p = 0.03 for comparison of patients with ≥ 2 to those without side effects).
Of 12 patients who had a second measurement of the rifampin level, dose changes were reported in five (figure 2). In four of these, the maximal levels were adequate after a dose increase (n = 3) or reduction (n = 1).
Follow-up
None of the patients with active TB had treatment failure and none of the patients treated for latent TB infection and who later received immunosuppressive drugs had a TB reactivation during a follow-up time between two and ten years.
DISCUSSION
In the present study we retrospectively evaluated rifampin levels which had been determined in routine practice in a mixed population consisting mainly of patients treated for active or latent TB. The data showed considerable inter-individual variation but in the majority of patients serum levels were adequate as based on two different criteria, one of which had been in use for decades at our institution and an alternative criterion based on a single peak level of at least 5 mg/l, which is nowadays implemented in several Dutch institutions. Nevertheless, the dose was adjusted in 20% of patients because of either too low or very high levels. In most patients in whom both C3 and C6 were available, C3 was highest and therefore most informative. Maximal serum levels were not affected by demographic parameters, the presence of comorbidities or use of co-medication.
Despite the recognition that adequate rifampin concentrations are crucial for treatment success, TDM is not common practice. In addition, there are no clear criteria for the interpretation of concentrations. Studies in animals showed that the AUC0-24 in steady state divided by the MIC was the best predictive parameter for efficacy of rifampin.18,19 In humans, treatment failure has been associated with low AUC0-24, 6 and with development of bacterial resistance.6,7 In a population pharmacokinetic model in patients with active TB, the rifampin AUC0-24 could be predicted with high precision using sampling at 0, 1, 3, and 8 hours after intake.16 However, such timing is not practical for most outpatients and the investment of the patient’s time and the costs must be weighed against the value of the information thus obtained. In a previous study a single measurement of rifampin at four hours after intake gave the best estimate for AUC0-24. 20 While precise AUC0-24 of rifampin is generally not needed, there are specific situations in which such information can be essential, such as in patients with extensive TB and a high bacillary load, or in patients with TB meningitis because of limited penetration. In general practice there may also be reasons to measure rifampin levels, however without the need for a precise AUC024, e.g. if treatment adherence is doubted, if poor absorption is suspected or because of suspected high levels. In these situations it may suffice to measure the concentration at the time of expected peak concentration. Because there is a large inter-individual variation in pharmacokinetics the peak value can be missed if just one sample is used. However, the results of the present study showed that C3 almost always exceeded C6. This is in agreement with a peak between 1 and 3 hours (occasionally 4 hours) after intake in studies in which multiple time points were used, the peak being closer to 2 hours if the drug was taken without food and closer to 3 hours if taken with a light meal.16,21 Thus, if full AUC0-24 is not required a single measurement at 2 to 3 hours after intake may provide sufficient information. In the limited number of patients in the present study in whom C6 exceeded C3 , more than half had a disorder associated with delayed gastric emptying such as diabetes mellitus, and including a later time point should thus be considered in that setting. In accordance with our finding, in a previous study in Indonesian patients the AUC0-6 was about 50% lower in patients with diabetes compared with nondiabetic TB patients.22 Trough levels were not informative and our data suggest that these could be omitted.
Combining data from the literature with those from the present study, we designed a simple and practical algorithm for the selection of time points for measurement of rifampin concentrations (figure 3). We think that testing rifampin concentrations at just one time point in most patients, and more frequently only on indication, could save time and money without loss of quality of care. In the LUMC, based on this study the single measurement is now implemented for routine practice, while AUC0-24 is available if needed. Regarding the standard rifampin dose of 600 mg it has been argued that the 600 mg dose is at the lower end of the dose-response curve.23 An update of the TDM in the treatment of tuberculosis of rifampin suggests higher doses to be more effective.24 The pharmacokinetic profile of rifampin is nonlinear and a dose increase will result in a greater than proportional increase in AUC. Previous studies using a higher rifampin dose of 13 mg/ kg or 20 mg/kg did not observe increased hepatotoxicity or other adverse events.23,25-29 In a recent study even a 1200 mg dose was well tolerated,30 indicating that a higher dose can probably be given without increasing the risk of side effects. Higher rifampin doses were evaluated in large clinical trials targeting Cmax values ≥ 8 mg/l. Higher doses were associated with a better outcome and/or no increase of toxicity.31-33 Boeree et al. even described a possibility of a shorter regimen of tuberculosis treatment with a higher dose (up to 35 mg/kg) of rifampin.32
A limitation of our study was the retrospective nature and the probable selection bias because rifampin levels were not routinely measured.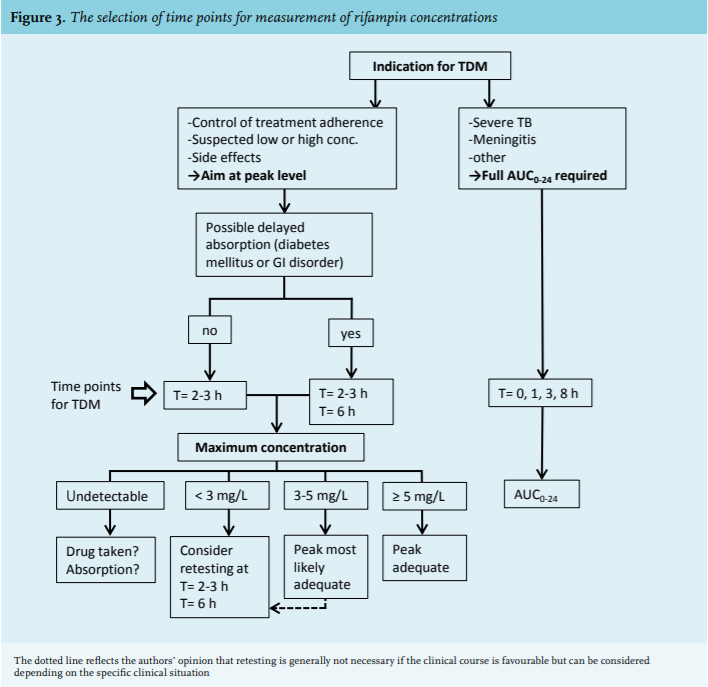
CONCLUSIONS
The results of this study show that in most cases a single rifampin level measured at 3 hours after intake provided sufficient information regarding adequacy of treatment. In the presence of risk factors for delayed absorption sampling at a later time point had added value. We think that a complete AUC0-24 measurement can be limited to specific situations. Our findings could contribute to a cost-effective, rapid and patient-friendly approach to TDM of rifampin and to effective treatment. However, further studies in different populations and settings are needed to assess the generalisability of our findings.
ACKNOWLEDGEMENTS
We thank Marianne van den Oever from the Department of Medical Dossier Administration for retrieving many patients’ charts from the archive.
DISCLOSURES
All authors declare no conflict of interest. No funding or financial support was received.
REFERENCES