KEYWORDS
Blood glucose control, guideline, hyperglycaemia, hypoglycaemia, intensive care unit, normoglycaemia
INTRODUCTION
For a long time stress-induced hyperglycaemia was seen as a protective response during critical illness,1 which was thus largely left untreated. Three single-centre randomised controlled trials showed benefit of a strategy aiming for age-adjusted normoglycaemia with intravenous insulin.2-4 Consequently, strict blood glucose control (tight glycaemic control) was implemented in many,5,6 but not all intensive care units (ICUs),7 worldwide. Lack of evidence for the benefit of tight glycaemic control in successive multicentre randomised controlled trials8-12 abated enthusiasm for this strategy. This includes the large Normoglycaemia in Intensive Care Evaluation and Survival Using Glucose Algorithm Regulation (NICE-SUGAR) trial13 which even suggested harm from tight glycaemic control. Also the finding that even mild hypoglycaemia is associated with a worse outcome of critically ill patients14-16 changed the opinion about tight glycaemic control, as hypoglycaemia is a frequent side effect of this strategy.2-4,8-13 Not surprisingly, major international guidelines for the management of critically ill patients changed their recommendations for blood glucose control.17,18
It is uncertain how and when ICUs in the Netherlands responded to the results from the NICE-SUGAR trial13 and the recently changed recommendations regarding blood glucose management in the Surviving Sepsis Campaign (SSC) guidelines of 2012.17 It is even more uncertain whether eventual changes in local guidelines for blood glucose control truly affected the practice of blood glucose management. Therefore, we studied ICUs in the Netherlands for changes in their guidelines for and practice of blood glucose management, from the year before publication of the NICE-SUGAR trial until the year after publication of the latest version of the SSC guidelines. We hypothesised that both publications resulted in new, higher target ranges for blood glucose control in ICUs in the Netherlands.
MATERIALS AND METHODS
We surveyed ICUs in the Netherlands for changes in their local guidelines for blood glucose management and retrospectively calculated frequently used metrics for blood glucose control from blood glucose datasets available at the National Intensive Care Evaluation registry.19 The employees of the National Intensive Care Evaluation registry had neither a role in the design of the survey nor in the calculation of metrics for blood glucose control from the blood glucose datasets, but extracted the blood glucose data and summarised patient demographics to guarantee complete anonymity of the participating units. According to Dutch law there is neither a need for ethical approval nor for individual patient consent to collect and analyse data from registries like the National Intensive Care Evaluation registry if patientidentifying information is excluded (Medical Ethics Review Committee of the Academic Medical Center project number W15_175).
Settings and participants
All ICUs that provide blood glucose datasets for central registration in the National Intensive Care Evaluation registry were invited to participate in the survey. For the calculation of metrics for blood glucose control we included all blood glucose data from patients admitted to the participating units. We only included critically ill adult patients. We excluded ICUs that did not respond precisely and completely to the survey and those that did not submit complete blood glucose datasets for the whole time frame. The time frame of interest was from September 2008 to July 2014, which included the publication of the NICE-SUGAR trial and the SSC guidelines.
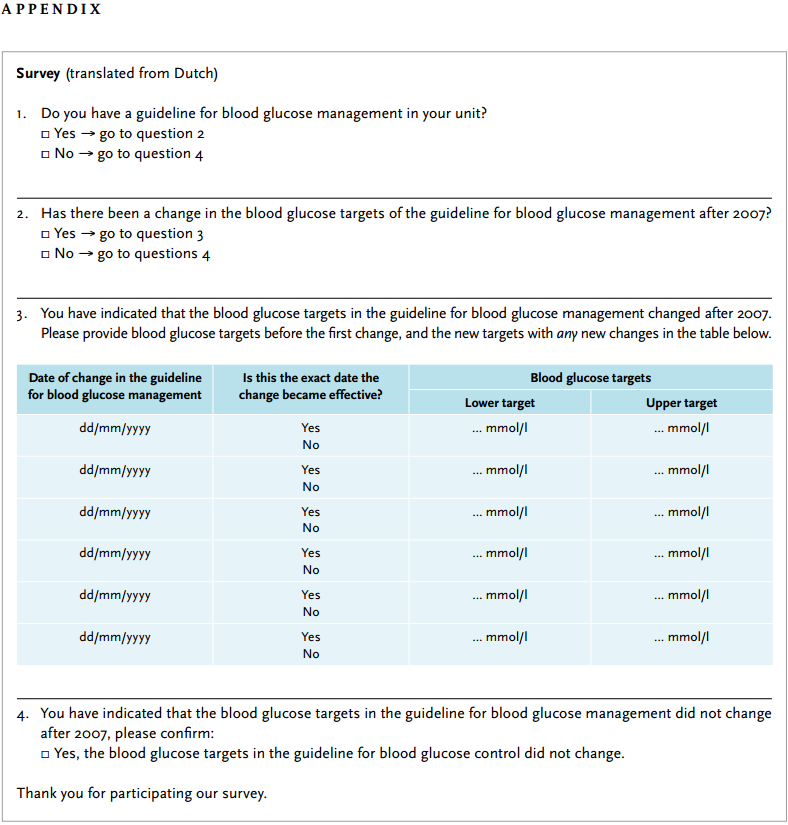
Survey
To ensure clarity and consistency, members of our multicentre research group (DD, RB, MJS) assessed the survey for face and content validity before the final version was compounded and sent to the National Intensive Care Evaluation registry. The units received the survey through the National Intensive Care Evaluation registry via email with a link to an online questionnaire in November 2011. A reminder was sent within one month if there was no response. The survey was repeated once for the selected ICUs in May 2014, again through the registry via email, also with a reminder within one month. The survey was repeated to also include the data available after the publication of SSC guidelines.
The survey had two simple questions focusing on changes in the targeted blood glucose levels in the guideline for blood glucose management (see Appendix):
Metrics for blood glucose control
A selection of units in the Netherlands submitted blood glucose datasets to the National Intensive Care Evaluation registry following strict and uniform definitions to ensure high quality of data.20 These blood glucose datasets contained all blood glucose data generated by point-of-care devices at the bedside, or by central laboratory devices when samples are analysed centrally, and can be the level in arterial, venous, or capillary blood. The National Intensive Care Evaluation registry deleted extreme values (i.e., 0 mg/dl and > 1802 mg/dl; to convert mmol/l, multiply by 0.0555) and duplicates (41 extreme values and 7343 duplicates [0.5% of the blood glucose data]). If the data for a certain unit contained more than 5% of extreme values, that unit was deselected from participation. We calculated the following frequently used metrics for blood glucose control21:
Analysis
Responses to the survey were collected through and anonymised by the National Intensive Care Evaluation registry, where the blood glucose datasets and the survey responses were labelled with meaningless codes allowing coupling of data without breaching the anonymity of the units.
Blood glucose metrics were calculated per individual ICU, and per admission category (i.e. surgical vs non-surgical patients). The main exposure variables were the dates of publication of the NICE-SUGAR trial (in March 2009) and the SSC guidelines (in January 2013). We considered these two publications to likely change clinical practice, or to trigger changes in the local guidelines for blood glucose management. Secondary exposures were changes in the local guideline for blood glucose management, revealed by the survey. Blood glucose metrics were summarised per period of exposure.
Statistical and SPC analysis
Data were reported as means (SD) or medians [IQR] where appropriate. Demographic data were summarised for all ICUs together and per unit, with each ICU having a meaningless number only used for comparisons. Descriptive analyses were performed with R (version: 3.1.1; R Foundation for Statistical Computing, Vienna, Austria), with p < 0.05 representing significance.
We used statistical process control (SPC) analyses to graphically describe glucose measurements and identify changes in blood glucose control.21-23 One of the SPC tools is the control chart. A control chart is a graph of data over time with three lines: the centreline (reflecting the mean) and an upper and lower limit (± 3 sigma from the mean). When the data points are, without any special pattern, within the control limits then the process is ‘in control’ and stable. With control charts a differentiation could be made between common cause and special cause variation. A common cause variation is an inherent and hence expected variation of the process. A special cause variation is a variation that is not expected and is caused by an external factor (e.g. changes in the local guideline for blood glucose management). We were interested in detecting sustainable changes over time, and specifically changes that show a shift in the mean of a process. We hence used the following common rule for detecting special cause variation: a ‘run’ of nine consecutive points (here each point reflects a complete ‘month’) on one side of the centreline. There are other rules for detecting other kinds of changes, such as isolated extreme points or local trends, but our chosen rule detects significant change in the mean over time, which was of interest to us. These nine consecutive points at one side of the centreline were used to recalculate the mean and control limits, which were extrapolated to subsequent months until a new significant change or until the end of the study period.24 Control charts were generated per ICU and per admission category group (i.e. surgical vs non-surgical patients).
RESULTS
Demographics
From 1 January 2008 to 30 June 2014, 49 ICUs sent blood glucose datasets to the National Intensive Care Evaluation registry. After excluding 32 units that could not provide the registry with a precise and complete response to the first survey, and after excluding ten units that provided blood glucose datasets that were either incomplete, or contained too many duplicate, extreme, or missing values, the final study population consisted of 44,767 patients admitted to seven ICUs (table 1). For the total group of patients we found that they were predominantly male, and most patients were admitted after surgery. Patient characteristics did not change over time. The units were all mixed medical-surgical units, four with a teaching affiliation. Also, the unit-level characteristics did not change over time.
Changes in local guidelines for blood glucose management
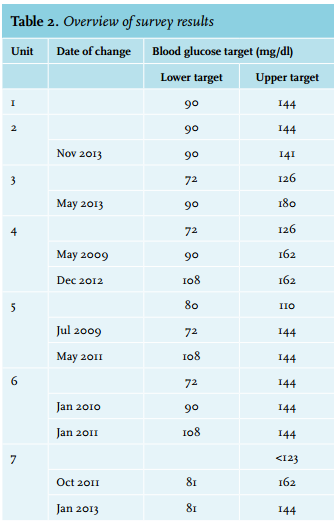
One unit reported no change in the blood glucose target levels (unit 1). One unit reported a change to a lower upper blood glucose target after publication of the SCC guidelines (unit 2), and one unit reported changes to raise the lower blood glucose targets on two occasions, once after publication of the NICE-SUGAR trial, and once after publication of the SCC guidelines (unit 6), with no change in upper blood glucose targets. In the other units, both the upper and lower blood glucose targets were changed at different time points. A detailed description of changes per unit including their timing is provided in table 2.
Trends over time in metrics for blood glucose control
An interrupted time-series analysis, with the publication of the NICE-SUGAR trial and the SSC guidelines as exposures, showed that the mean blood glucose level increased from 132 [121-146] mg/dl before publication of the NICE-SUGAR trial to 143 [129-159] mg/dl after publication of the SCC guidelines (figure 1, upper panel).
Furthermore, the relative proportions of hypoglycaemic and severe hypoglycaemic measurements decreased over time, while the relative proportion of hyperglycaemic and severe hyperglycaemic measurements increased. There were notable differences between ICUs: in some units no, or only modest changes were noted, while in other units large changes were seen in almost all metrics (figure 1, upper panel). In one unit the metrics moved in a direction other than expected based on the changes in the local guideline for blood glucose management (unit 6). An interrupted time-series analysis with changes in the local guideline as the exposures showed similar patterns (figure 1, lower panel); trends were not different for non-surgical and surgical patients (data not shown). 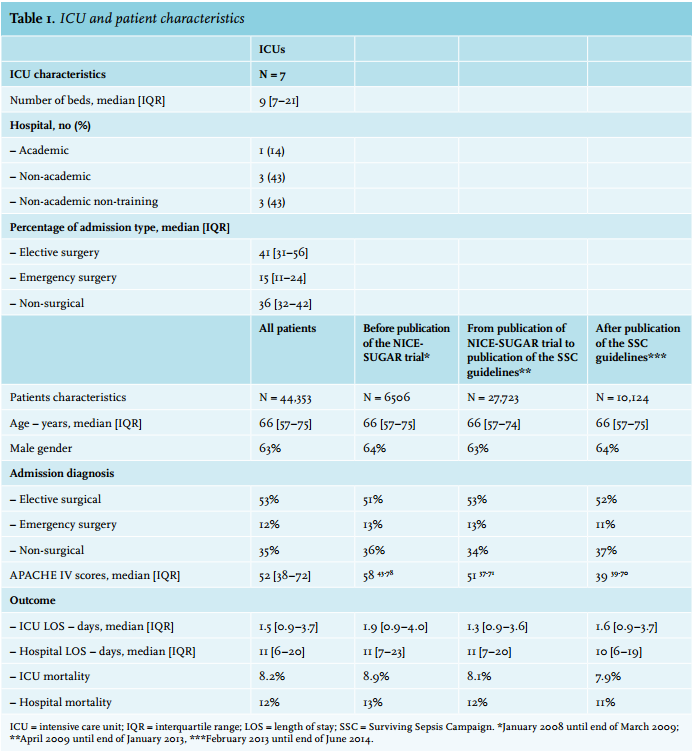
Date of change in local guideline for blood glucose management in relation to trends in metrics for blood glucose control
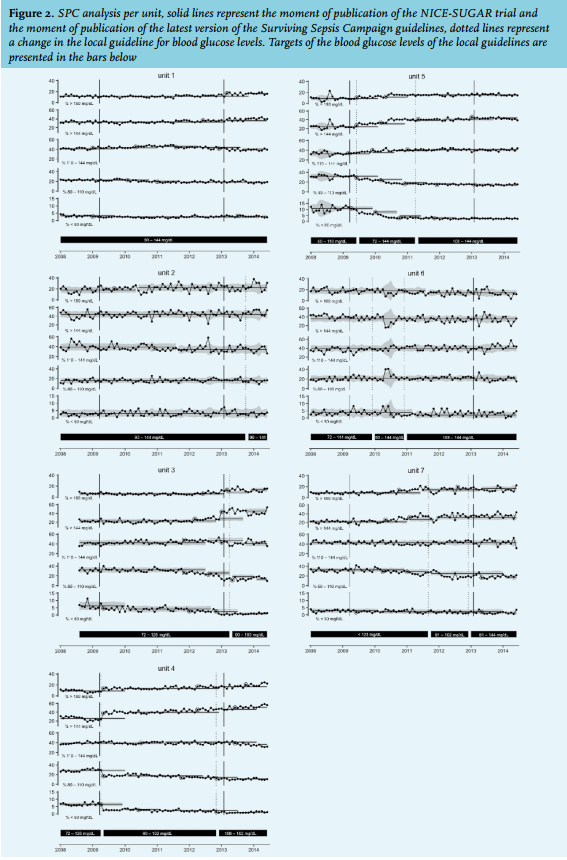
The SPC charts showed an increase in hyperglycaemic measurements and a decrease in hypoglycaemic measurements in almost all ICUs (figure 2). The charts showed special cause variation shortly after the publications of the NICE-SUGAR trial and the SSC guidelines in some of the units (i.e. unit 4 and unit 5), and also close to the moment a change was made in the local guideline for blood glucose management (i.e. in unit 4 and unit 5). In some units, a change in the local guideline was not followed by a special cause variation (i.e. unit 6), and some cases of special cause variation appeared spontaneously (i.e. seemed not to be related in time to the publications or changes in local guidelines (e.g. unit 1)). The SPC charts of non-surgical and surgical patients showed similar trends in metrics for blood glucose control (data not shown).
DISCUSSION
In this study, we found that six out of seven ICUs in the Netherlands changed their local guideline for blood glucose management after publications of the NICE-SUGAR trial in 2009,13 and the SSC guidelines in 2012.17 In five out of the six units that changed their guideline, the targeted upper and/or lower blood glucose levels were higher after these two publications, with notable differences between units. Changes in the local guidelines were associated with trends in metrics of blood glucose control: in general, the mean blood glucose levels modestly increased, and the relative proportions of hypoglycaemic and severe hypoglycaemic measurements decreased while the relative proportion of hyperglycaemic and severe hyperglycaemic measurements increased. There were differences between the units, but trends were comparable for surgical and non-surgical patients within units. To our knowledge, this is one of the first studies to investigate whether tight glycaemic control has been adopted, as recently suggested.25 Our study provides useful insights into the way Dutch ICUs responded to new evidence, and how the practice of blood glucose control responds to changes in local guidelines. The findings of our study could also be important for those who plan intervention studies of blood glucose practice.
Studies reporting on trends in practice of blood glucose control in ICUs are scarce. In 2010, we ourselves found that tight glycaemic control was practised in nearly half of the ICUs in the Netherlands.5 In New Zealand and Australia, however, only 10% of the units practised tight glycaemic control before publication of the NICE-SUGAR trial, and the practice of blood glucose control hardly changed after publication of that trial.7 Of note, many ICUs in New Zealand and Australia were involved in the NICE-SUGAR trial. Recently, trends in practice of blood glucose control in 113 units in the USA were reported.6 That analysis, covering the years 2001 to 2012 and thus the time frames between and after the publication of all major trials of tight glucose control, showed a slow adoption of tight glucose control after the initial trial, but little to no adaptation after the last trial. The results of the present analysis are, at least in part, in line with these previous investigations. Although the local guidelines changed with regard to the upper and lower targets, the changes in several metrics of blood glucose control were modest, suggesting that there is no complete adaptation of this strategy in the Netherlands.
Our study differs from the previous studies on trends in practice of blood glucose in several ways. First, in contrast to the two studies from New Zealand and Australia7 and the USA6 in which only the highest and lowest blood glucose levels in the first 24 hours after admission to the ICU were used, we used all blood glucose data per patient to calculate the reported metrics for blood glucose control, which we think is more accurate.26 Second, we report the results per unit, which not only allows comparisons between units, but also the trends in blood glucose management after a change in local guidelines. Third, we collected data until July 2014 and were thus able to determine the effects of publication of the SSC guidelines on local guidelines and the practice of blood glucose control. And finally, we used SPC charts that allow a principled approach to detection of changes and a better interpretation of how changes in the local guidelines affected the practice of blood glucose control. All this allows caregivers a better insight into what affects the practice of blood glucose control, and when to check whether changes are truly effective.
One finding was that there were clear trends in metrics for blood glucose control that seemed independent of any change in the local guidelines for blood glucose; some trends even happened without a change in the guideline. This certainly means that practice of blood glucose control responds to other factors, such as other publications in the literature, or changes in practice not reported in the survey, e.g. changes in nursing or medical staff and measurement techniques, use of computer-assisted algorithms, et cetera. It is also important to notice that ICUs in the Netherlands remain relatively tight in their practice of blood glucose management. Indeed, at the end of our study the median blood glucose levels in units in the Netherlands were still lower than those reported in Australia and New Zealand7 and the USA.6
While meta-analyses suggest that surgical patients could benefit more from tight glycaemic control than non-surgical patients,18,27,28 our study shows that blood glucose control is not different between these subgroups of patients in the ICUs in the Netherlands. This is in line with the abovementioned study from Australia and New Zealand.7 The literature also suggests that patients with a history of diabetes could benefit from blood glucose practice targeting higher blood glucose levels.16,29,30 Unfortunately, we were not able to study data regarding the diabetic status of patients.
This study has several limitations. First, since we were interested in changes in the local guidelines and the association in time with trends in metrics of blood glucose control, we had to exclude many ICUs. This could have led to bias, as units that did not respond to the survey could have guidelines for blood glucose management that markedly differ from those that responded to the survey. Second, this is a retrospective study with data collected for quality enhancement purposes. Finally, we were not able to determine whether a blood glucose level came from an arterial or venous sample, and some measurements may have involved capillary blood, or which technique was used to measure the blood glucose level.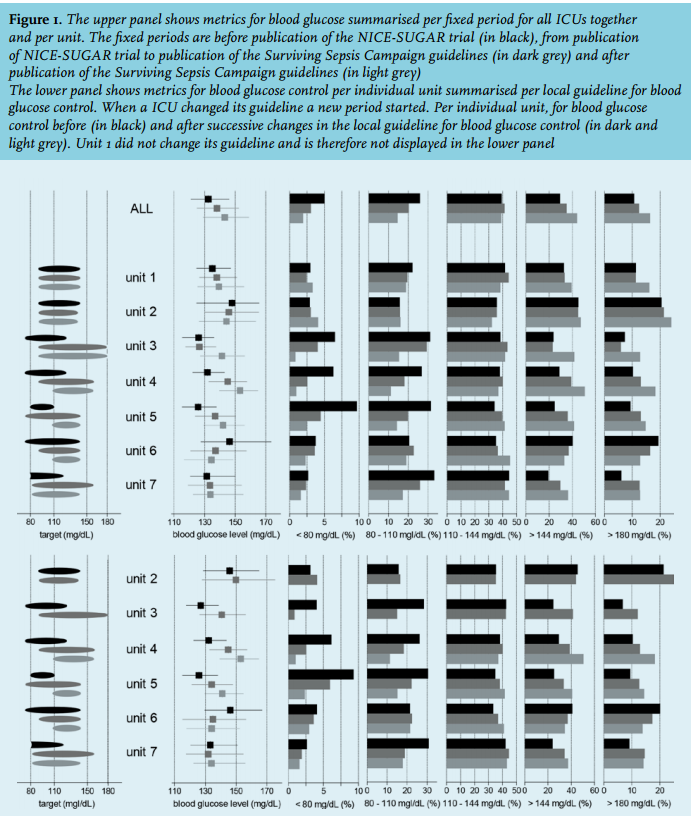
CONCLUSIONS
Local guidelines for blood glucose practice have changed in ICUs in the Netherlands since the publication of the NICE-SUGAR trial and the new SSC guidelines. Trends in the metrics for blood glucose control, however, suggest only modest adoption of tight glycaemic control.
DISCLOSURES
Roosmarijn T.M. van Hooijdonk reports consulting work for Medtronic Inc., GlySure Ltd and research support from Medtronic Inc and Optiscan Biomedical – all fees and financial supports were paid to the institution.
Marcus J. Schultz reports receiving consultant fees from Medtronic Inc., GlySure Ltd., Edwards Life Sciences and Roche Diagnostics and financial support from Medtronic Inc. and OptiScan Biomedical – all fees and financial supports were paid to the institution.
The other authors do not report any relevant disclosures. The NICE Foundation pays the Department of Medical Informatics to maintain, process and analyse data from the NICE registry. Ameen Abu-Hanna is head of the department of Medical Informatics. Nicolette F. de Keizer, Ferishta Bakhshi-Raiez, and Saeid Eslami are employees of the department of Medical Informatics and work on the NICE registry.
Dave A. Dongelmans, Rob J. Bosman, Ingrid van Dijk and Nicolette F. de Keizer are members of the board of the NICE Foundation.
REFERENCES